
By analyzing the conversion funnel, you can pinpoint the specific stages where users are dropping off or experiencing difficulties. This report provides actionable insights that help you make data-driven decisions, enhance user experience, and improve your conversion rates.
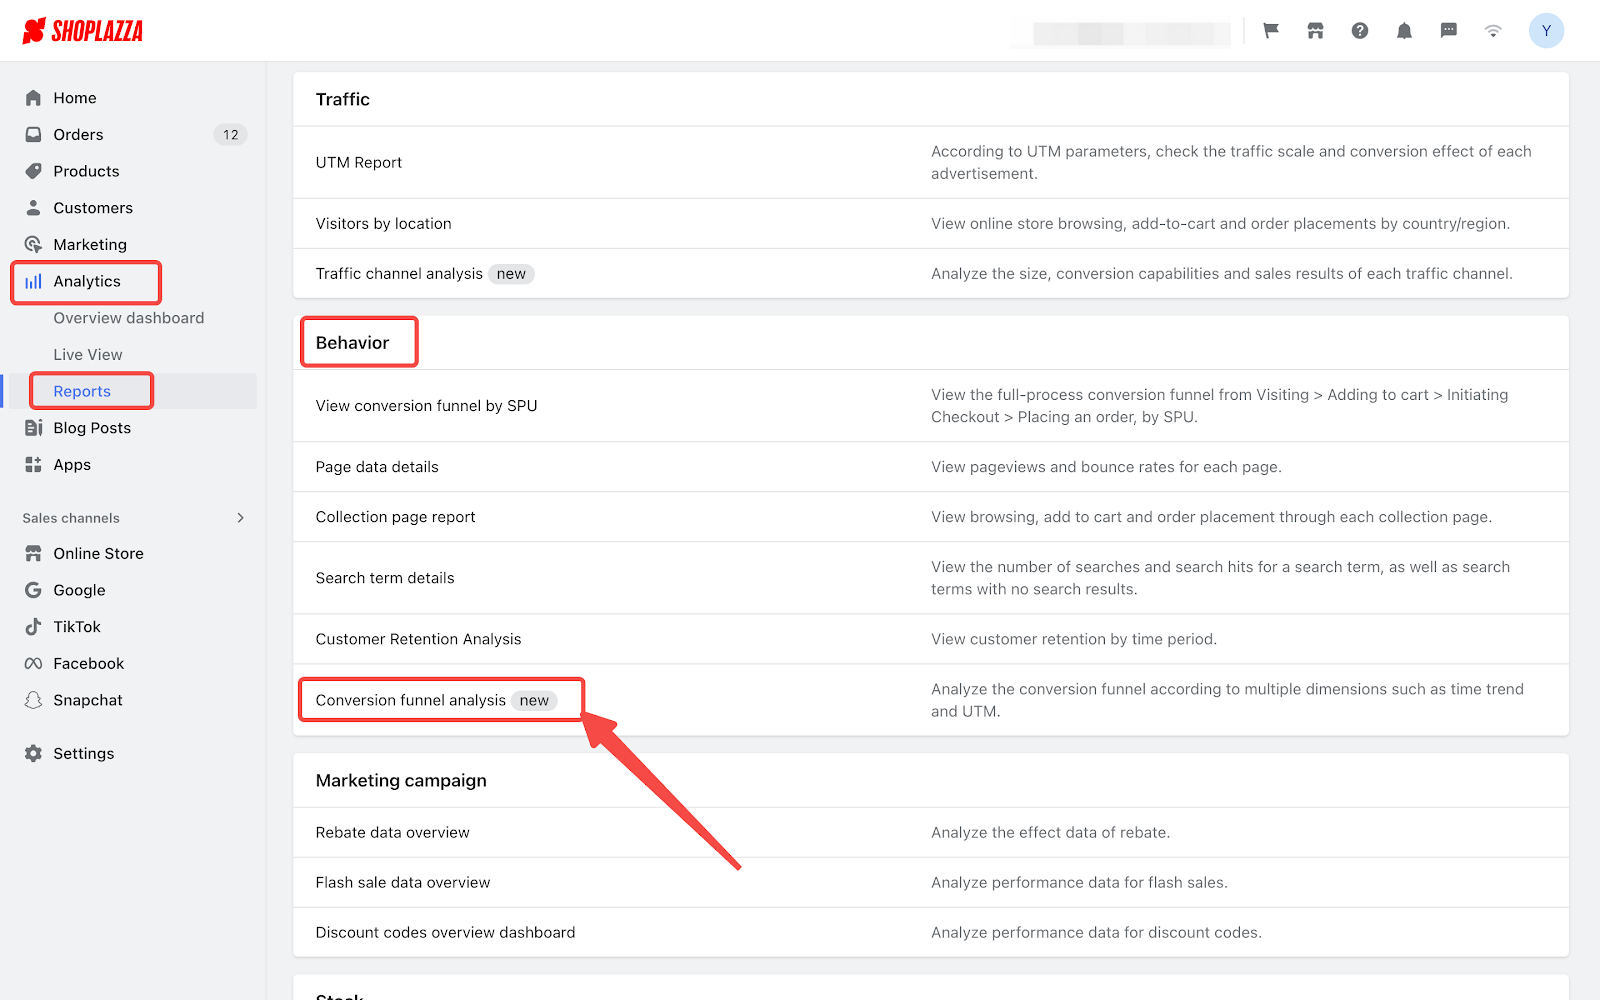
From your Shoplazza admin > Analytics > Reports, click Conversion funnel analysis under the Behavior section.
Optional analysis dimension
You can click the tabs (Time trend analysis and Analysis by UTM) above the chart to view corresponding trend chart within the time period you selected.

Time trend analysis
When you select "Time trend analysis", you can directly view the trend chart below.

Analysis by UTM
When you select "Analysis by UTM", you can click Edit columns to customize the header of the table below.

Customizable time period
By default, the page displays the data of Today (from 0:00 to the time of entering the page) based on the time zone of the store. You can choose different time periods in the dropdown to view corresponding data, or select Custom to select specific dates to form a time period.

Data exporting
For more detailed analysis, you can export the displayed data to an Excel file by clicking Export.

Indicators of the report
| Indicators | Definition |
| Visit the store | Total number of users visiting the site. |
| Add to shopping cart | The number of unique users who added 1 or more items to the shopping cart. |
| Initiate checkout | The number of unique users who started the checkout process. |
| Order volume | Sum of placed orders. |
| Conversion rate | The percentage of website visitors who complete a purchase. |


Comments
Please sign in to leave a comment.