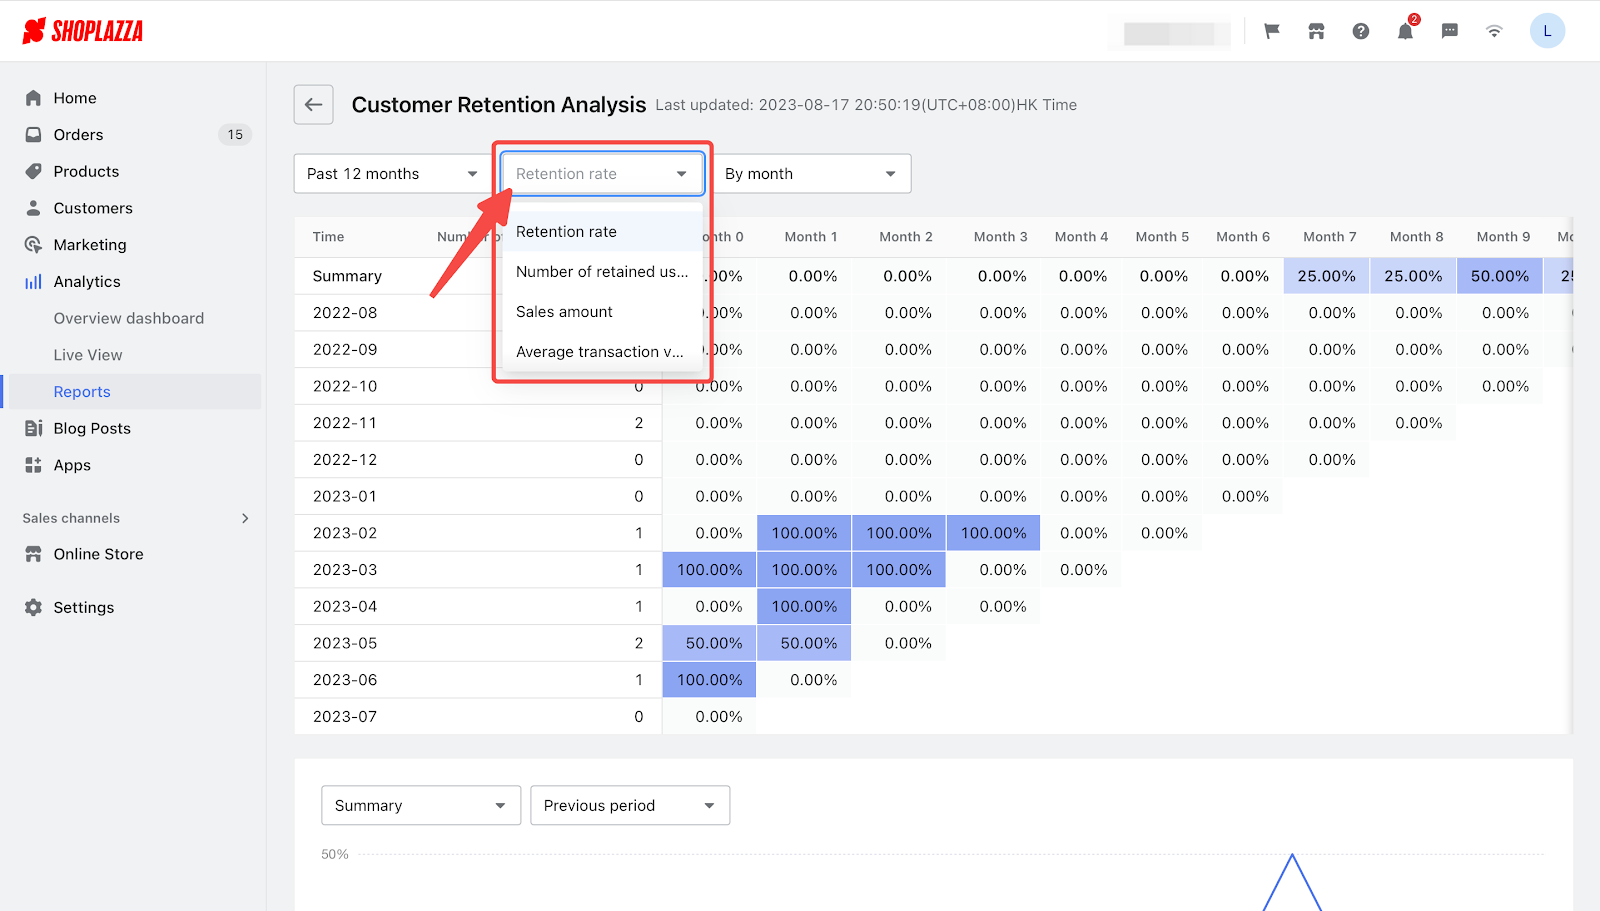
Understanding customer retention is an important aspect of gauging the loyalty and satisfaction levels of your customer base. This data allows you to implement targeted marketing strategies aimed at retaining repeat customers. Here's how to access this valuable information:
Steps
From your Shoplazza admin > Analytics > Reports, scroll until you reach the Behaviors section, and then click Customer Retention Analysis.

Selecting time ranges
In this section, you have the ability to select different time ranges from a dropdown menu.

Note
- By default, the data in past 12 months will be displayed.
- When selecting a time range from the dropdown, only complete months are included. The current month, since it has not yet ended, is not part of this data. For example, if you want to view the data in the past 12 months on July 29, 2023, the page will show you the data from June 1, 2022 to June 30, 2023.
Key performance indicator
- Retention rate: This indicator is calculated based on the "number of customers who place an order" and measures the proportion of customers who make repeat purchases during a specific period of time. For example: If 100 customers made purchases in June, and 50 of them returned, the retention rate would be 50%.
- Number of retained users: This indicator measures the number of customers who make repeat purchases during a specific period of time. For instance, if 100 customers bought items in June and 50 returned to make another purchase, this number would be 50.
- Sales amount: This indicator measures the sales amount of repeat purchases during a specific period of time.
- Average transaction value: This indicator measures the average order value generated during repeat purchases. If 100 customers made 140 orders amounting to $28,000, the average order value would be $200.

View data collected by a certain time unit
- By default, the data collected By month will be displayed.
- You can also change the option to view the data collected By quarter.

Trend analysis chart
- Altering the selections in the above dropdown menus will dynamically update the trend chart below, allowing you to visualize key performance indicators over time.

With these tools and metrics at your disposal, you're well-equipped to make informed decisions. Understanding these key performance indicators is a significant step toward building long-term relationships with your customers and creating a sustainable business model.


Comments
Please sign in to leave a comment.