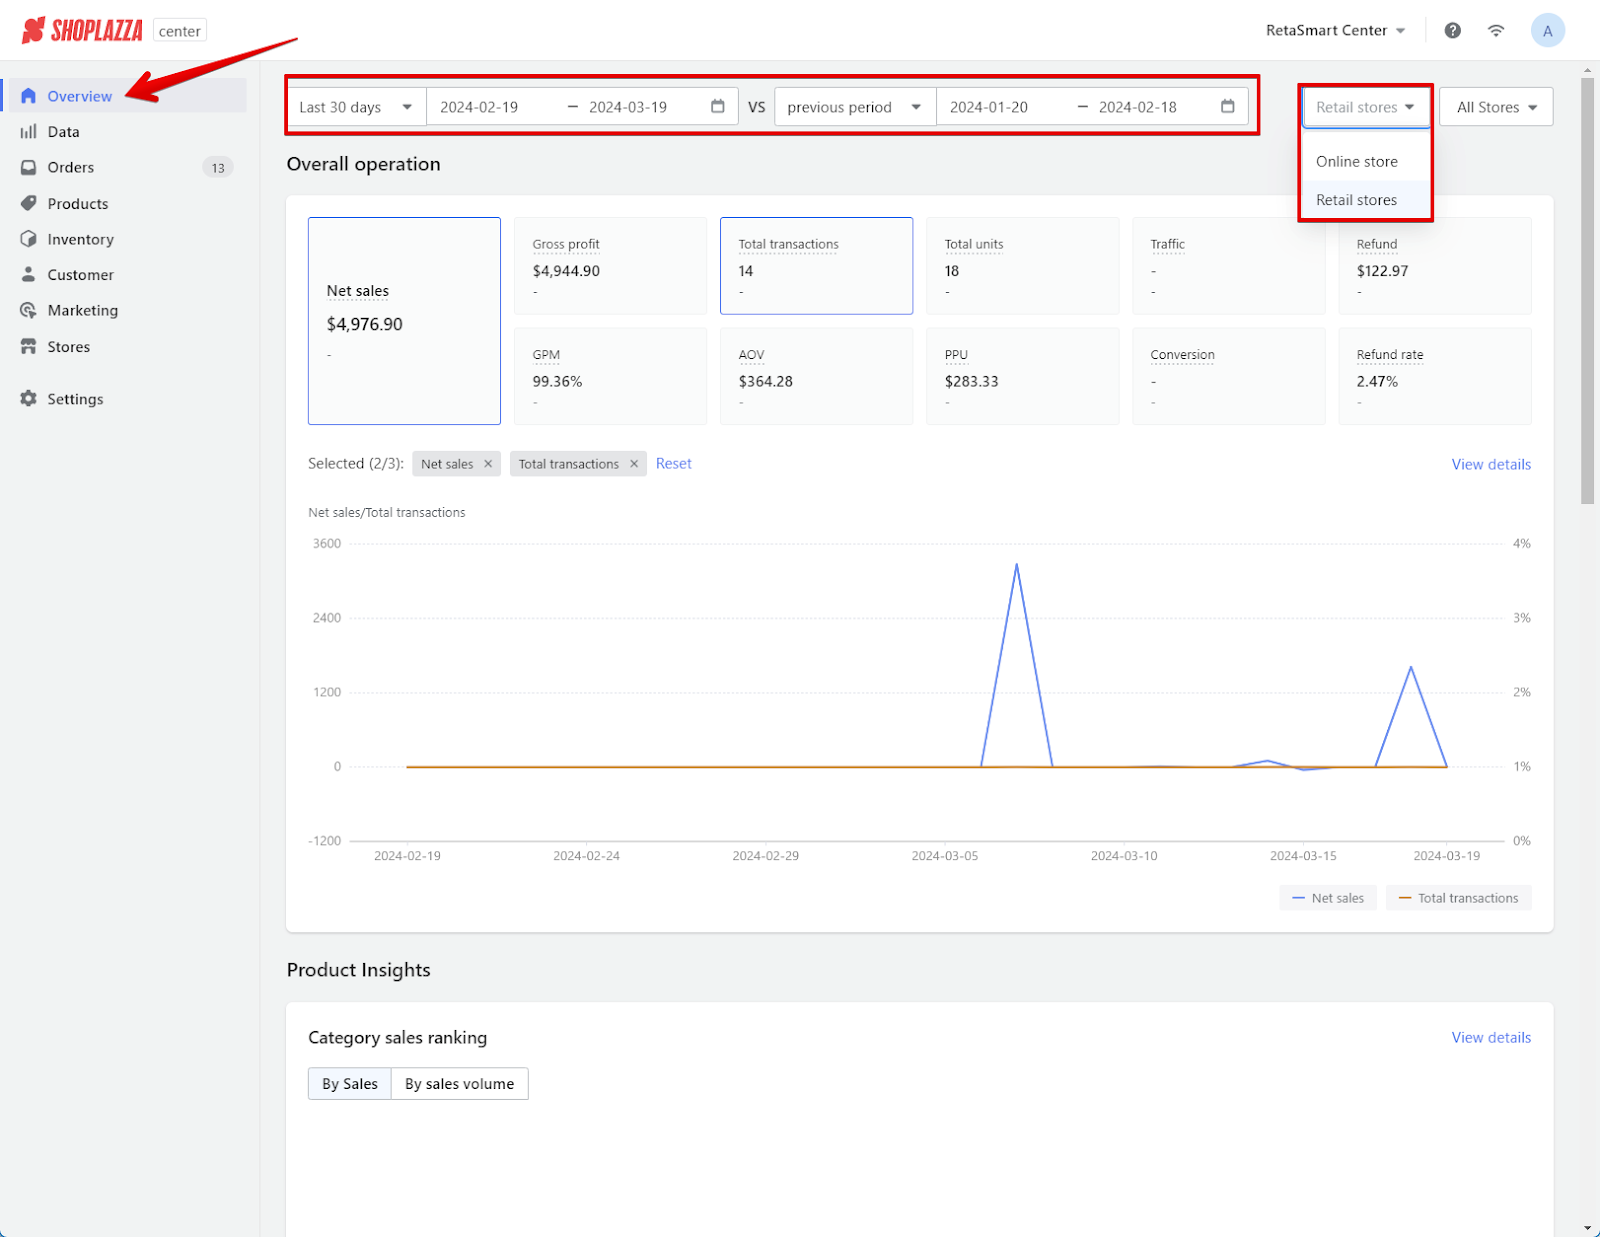
The Overview section gives you a quick look at total sales across all channels or specific locations within a selected timeframe. This at-a-glance view is great for spotting trends and performance highlights.
Steps
1. Online and retail store insights: See detailed reports for both online platforms and physical stores, including sales rankings, traffic conversion, and after-sales analysis.

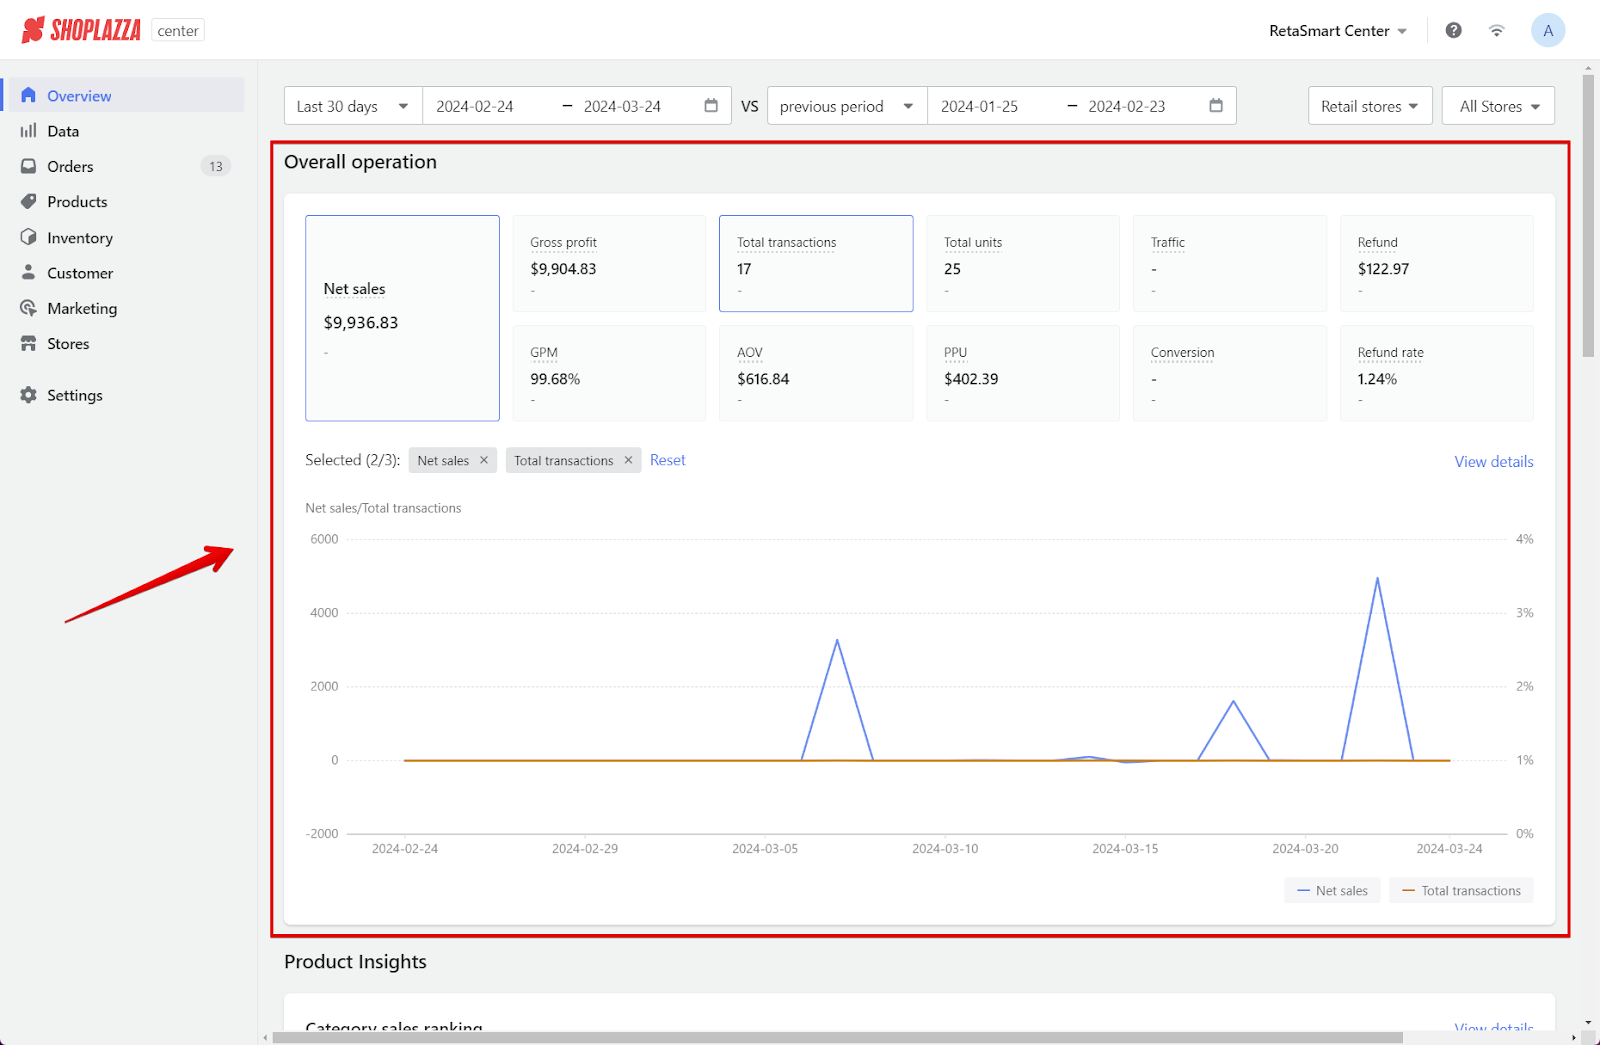
2. Overall operation: Right at the top, you'll find your net sales, gross profit, and key numbers like how many sales you've made and how many people have visited. This helps you quickly check on how your business is doing financially.

3. Product insights: Dive deeper to see which products sell best and which might need a marketing boost. You can look at sales by category to understand your product lineup.

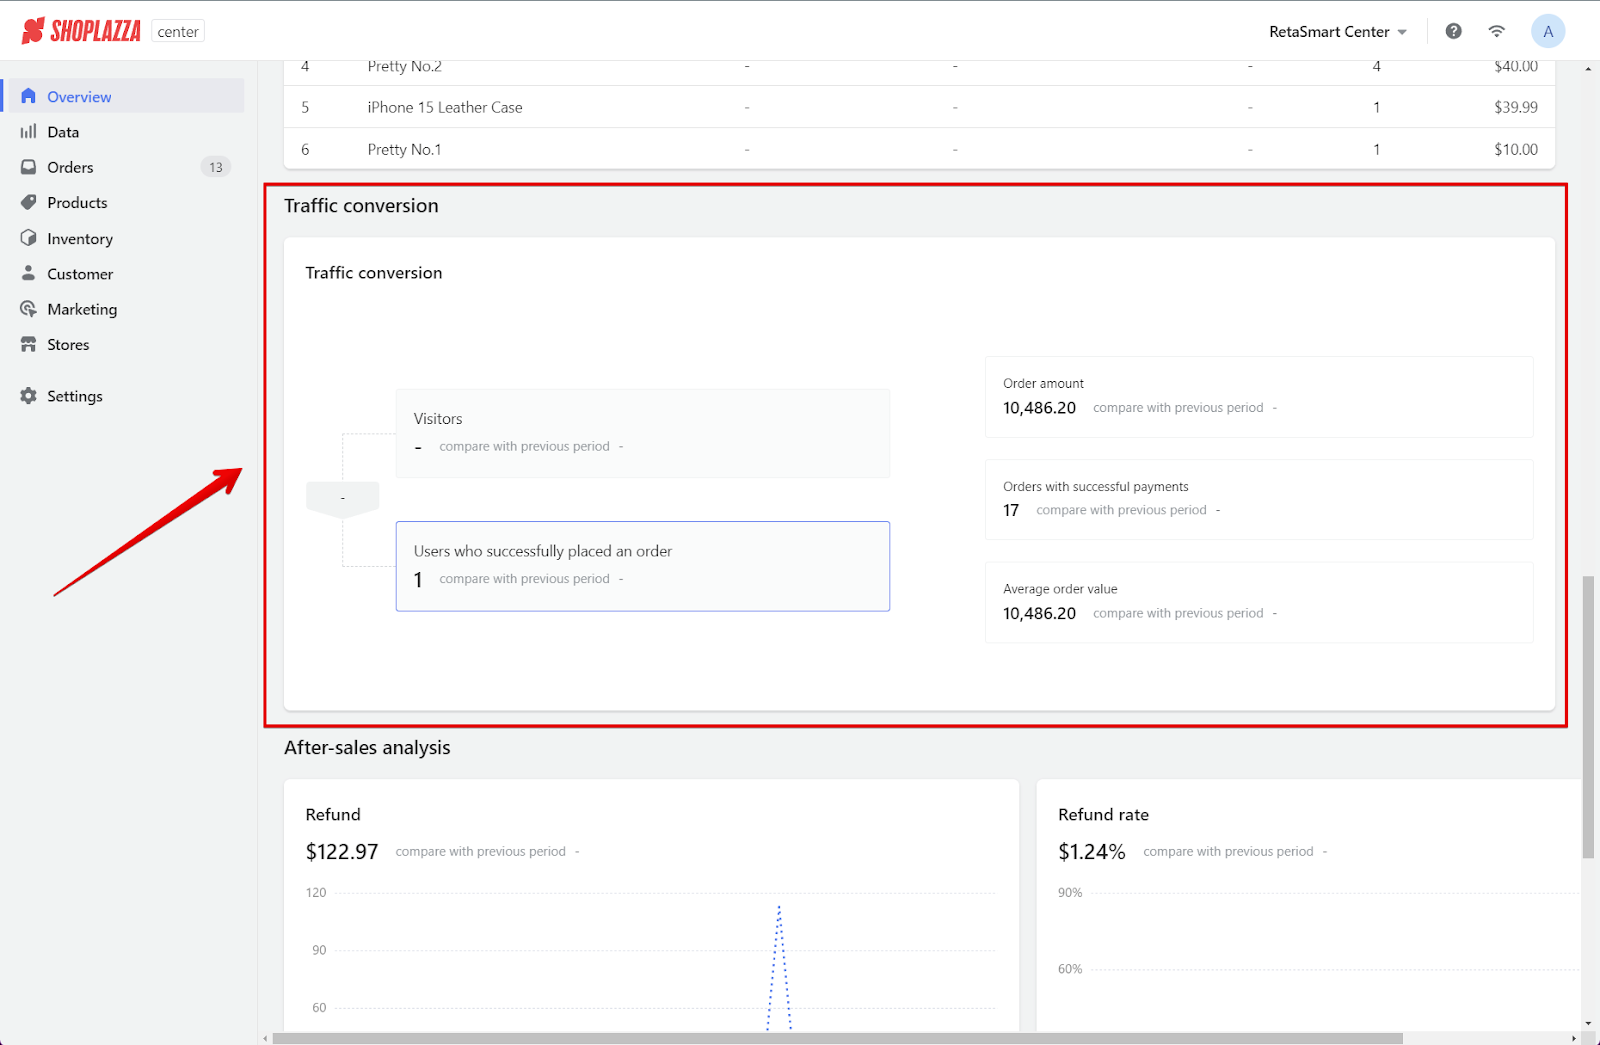
4. Traffic conversion: This part of the dashboard shows how many visitors purchase products. It's a simple way to measure if your store successfully makes sales from the traffic you get.

5. After-sales analysis: Finally, take a look at your returns. This tells you how much money is being refunded and how often so you can figure out if customers are happy with their purchases and which products might be causing issues.

With its straightforward design, this dashboard gives you the clarity you need to make informed decisions and keep your business on track.


Comments
Please sign in to leave a comment.