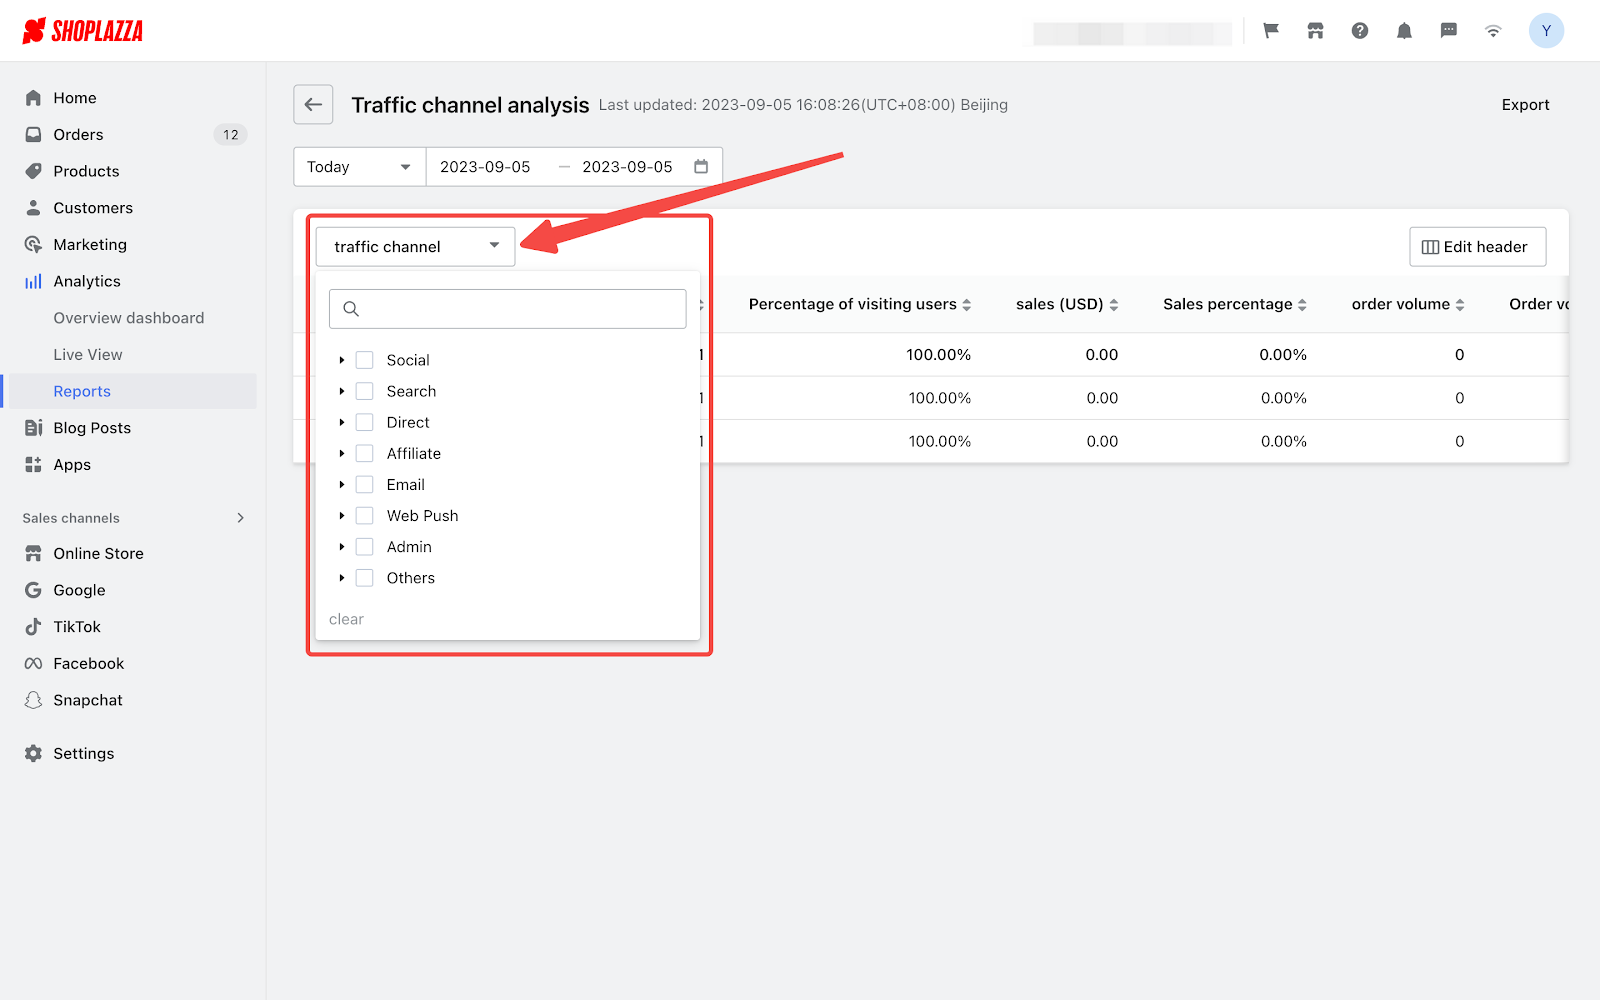
Gaining insights into your store's traffic sources helps you identify which channels are most effective in gaining visitors. The Traffic channel analysis report allows you to make smarter investments in high-performing channels and evaluate the impact of your current promotional strategy. This data informs your SEO campaigns and impacts your business overall.
Steps
From your Shoplazza admin > Analytics > Reports, click Traffic channel analysis report under the Traffic section.

Note
In this report, the last interaction point before a user completes an action, such as making a purchase, is credited as the contributing source.
This means if someone clicks on a Facebook ad and then a Google link before buying something, Google gets the credit for that sale in the report.
Features of the report
Customizable time period
By default, the page displays the data of Today (from 0:00 to the time of entering the page) based on the store's time zone. You can choose different time periods in the dropdown to view corresponding data or select Custom to select specific dates to form a time period.

Optional traffic channel
You have the flexibility to focus on a specific traffic channel to evaluate its performance.

Editable headers
Customize the columns in the report by clicking the Edit header button. To rearrange columns, simply hover over and drag the drop icon next to each column.


Data exporting
For more detailed analysis, you can export the displayed data to an Excel file by clicking Export.

Indicators of the report
| Indicators | Definition |
| Traffic channel |
Specific sources through which visitors or potential customers arrive at your store. E.g. Facebook, Google |
| Traffic type |
Ways through which visitors or potential customers reach the traffic channels. E.g. Social, Search |
| Access user | Sum of users who accessed the website through specific channels. |
| Percentage of visiting users | The number of visitors from specific channels, divided by the number of all visitors. |
| Sales (USD) | Total revenue from completed orders through specific traffic channels. |
| Sales percentage | The revenue of completed orders through specific traffic channels, divided by the revenue of all completed orders. |
| Order volume | Sum of placed orders from specific traffic channels. |
| Order volume ratio | The number of orders from specific traffic channels, divided by the number of all orders. |
| Conversion rate | The number of visitors to your website or store, divided by the number of those that complete their orders. |
| Average order price (USD) | Total revenue from completed orders, divided by the number of completed orders. |
| Viewed item | The number of unique users who are navigated to product pages through specific traffic channels. |
| Users who added to cart | The number of unique users who added 1 or more items to the shopping cart through specific traffic channels. |
| Reached checkout | The number of unique users who started the checkout process through specific traffic channels. |
| Users who placed an order | The number of users who place orders through specific traffic channels. |


Comments
Please sign in to leave a comment.