Flash sale campaign is a common marketing stategies that help stores to develop a sense of urgency and boost sales. Flash sale report in your Shoplazza Admin > Analytics > Reports displays the performance of your flash sale campaign. We provide detailed marketing data evaluating your existing campaigns, in an effort to help you make follow-up marketing plans and therefore increase store conversion.
Viewing your Flash Sale Report
1. You can go and check out your rebate report at Shoplazza Admin > Analytics > Reports > Marketing campaign > Flash Sale Data Overview.

Selecting Time-frame Indicators
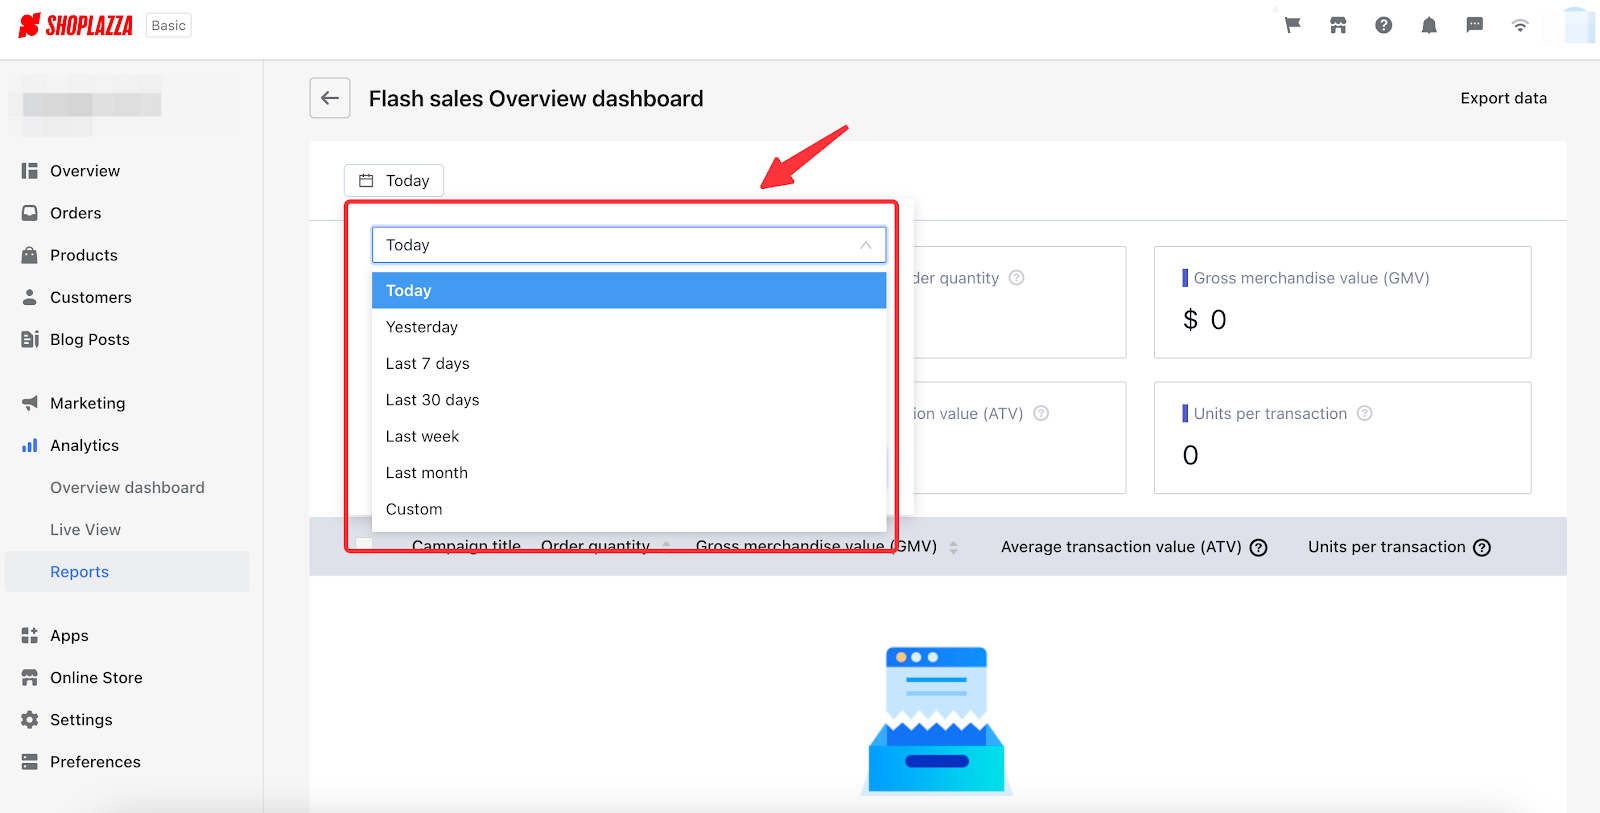
1. Click on the time period dropdown menu to select a time frame indicator.

Note
Your rebate report will automatically display today's data (from 0:00 am to the moment you click on the report).
Selecting the Custom option from the drop-down menu to personalize your report.
Exporting Rebate reports
1. Use the Export Data button on top right to save a copy of your flash sale report.

In the chart below, you can identify the meanings of every indicator in your flash sale report:
| Modules | Indicators | Definitions |
| Data Displayed in the Overview | Order Quantity | The overall quantity of order placed during the flash sale campaign |
| Percentage of Order Quantity | Campaign Order Quantity / Total Order Quantity | |
| Gross Merchandise Value (GMV) | The total amount of sales from the flash sale campaign | |
| Percentage of Sales Revenue | Campaign Revenue / Total Sales Revenue | |
| Average Transaction Value (ATV) | Total Sales Revenue / Total Order Number | |
| Units per Transaction | Item Quantity / Number of Orders | |
| Data Displayed in the Chart | Campaign Title | The name of the flash sale campaign |
| Order Quantity | The overall quantity of order placed during the flash sale campaign | |
| Gross Merchandise Value (GMV) | The total amount of sales from the flash sale campaign | |
| Average Transaction Value (ATV) | Total Sales Revenue / Total Order Number | |
| Units per Transaction | Item Quantity / Number of Orders |
As a common marketing strategy, flash sales campaigns have proved to be one of the useful tools for creating a sense of urgency. By analyzing the data, you can identify which products performed the best, which time of day had the highest sales, and which marketing channels drove the most traffic.


Comments
Please sign in to leave a comment.