
Sales trend report displays views, add-to-carts and sales data in a direct way. You can find the best-sellers in your store, understand your viewers' demands and even optimize your advertising plans. Trend charts make your marketing strategies clearer than ever.
Monitoring Your Marketable Products
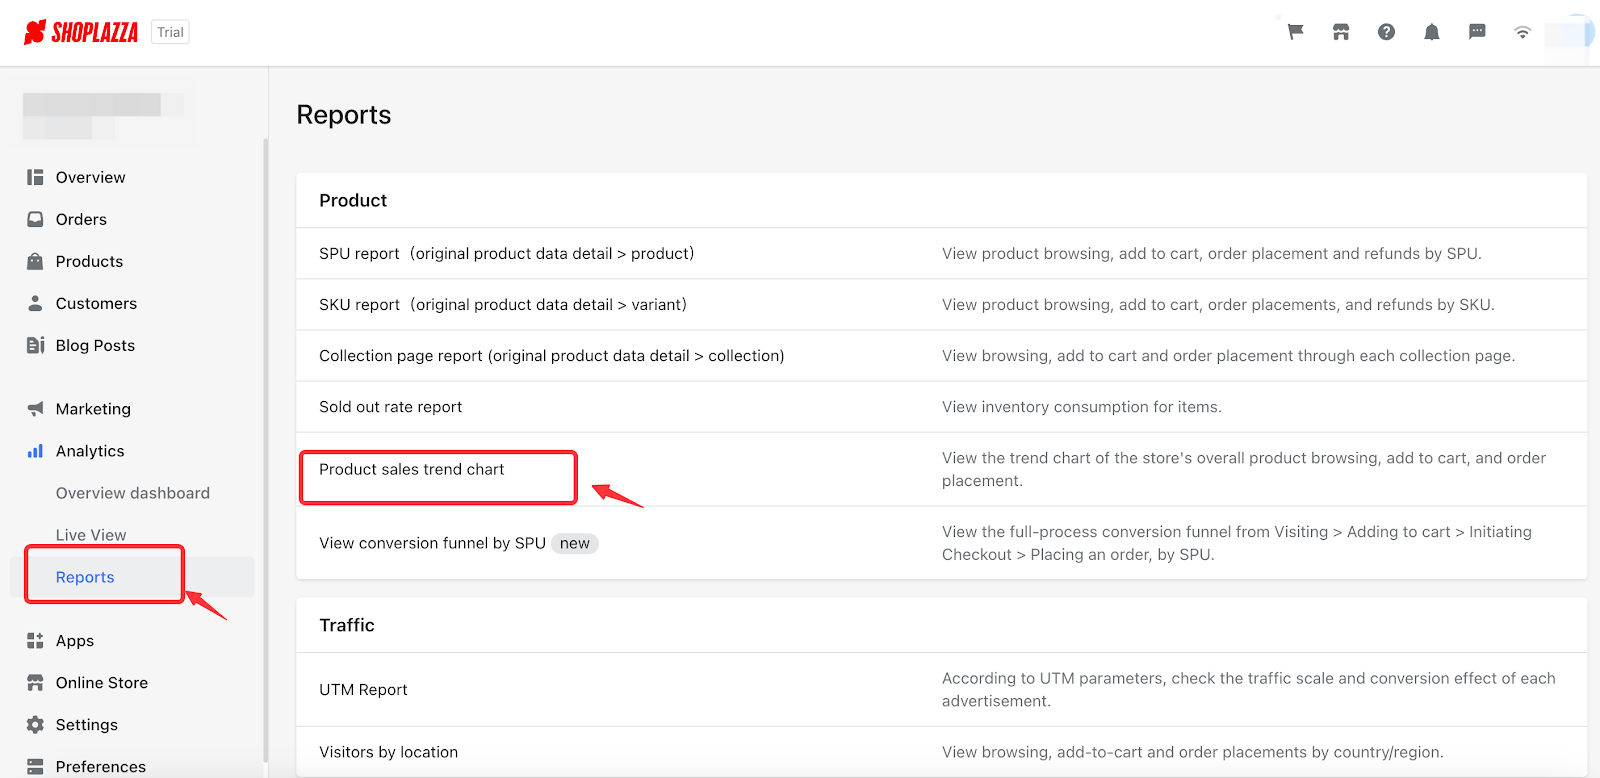
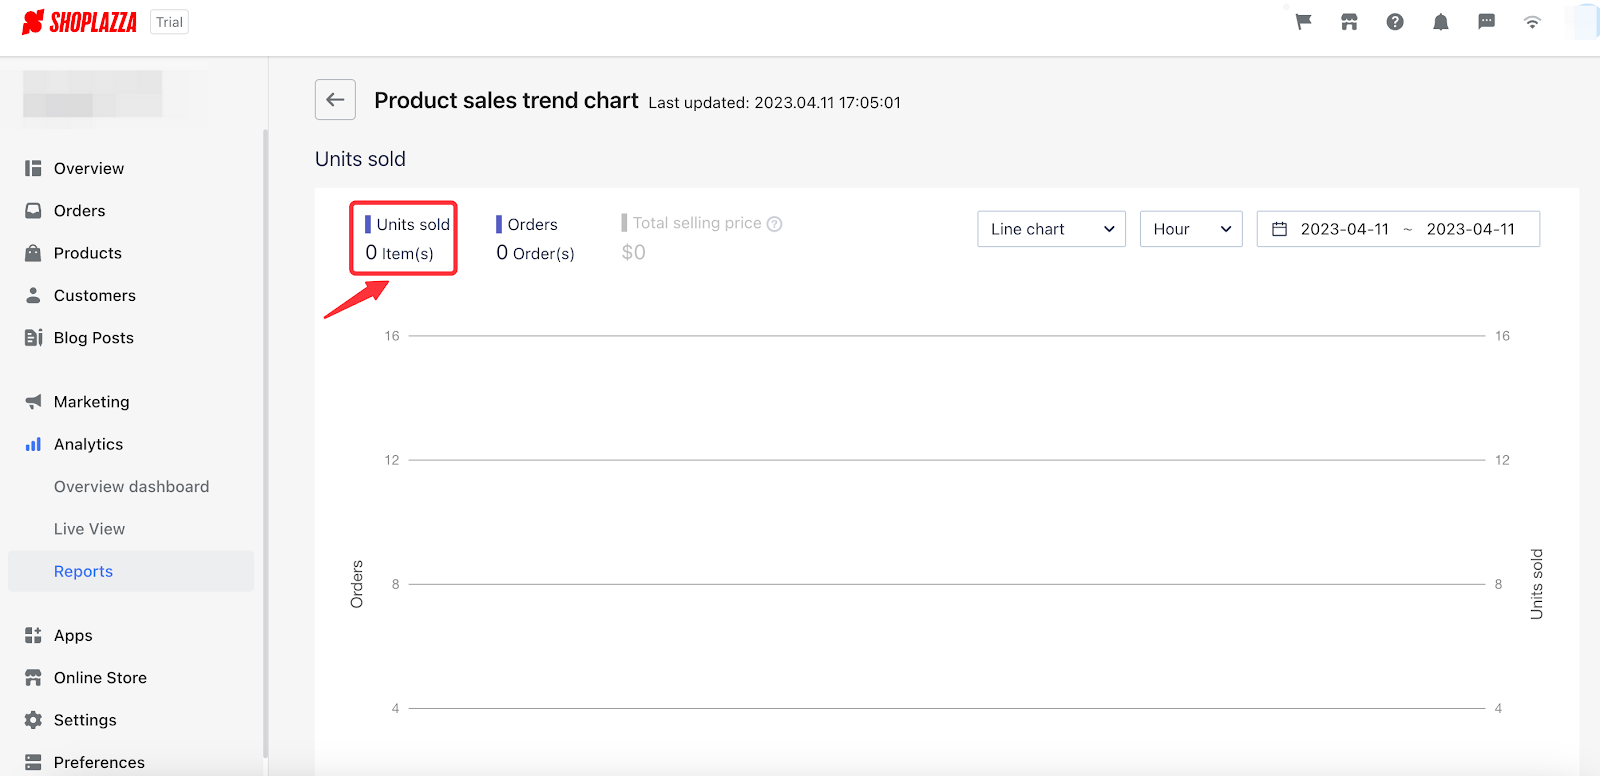
Marketable products in your store play a leading role in sales and product structures. Trend charts in Shoplazza admin help you figure out the next key point of your marketing plan. Go and check out your trend charts in Shoplazza Admin > Analytics > Product > Product Sales Trend Chart.
Changing the time range for analysis
Click on the date column to examine another time scope.
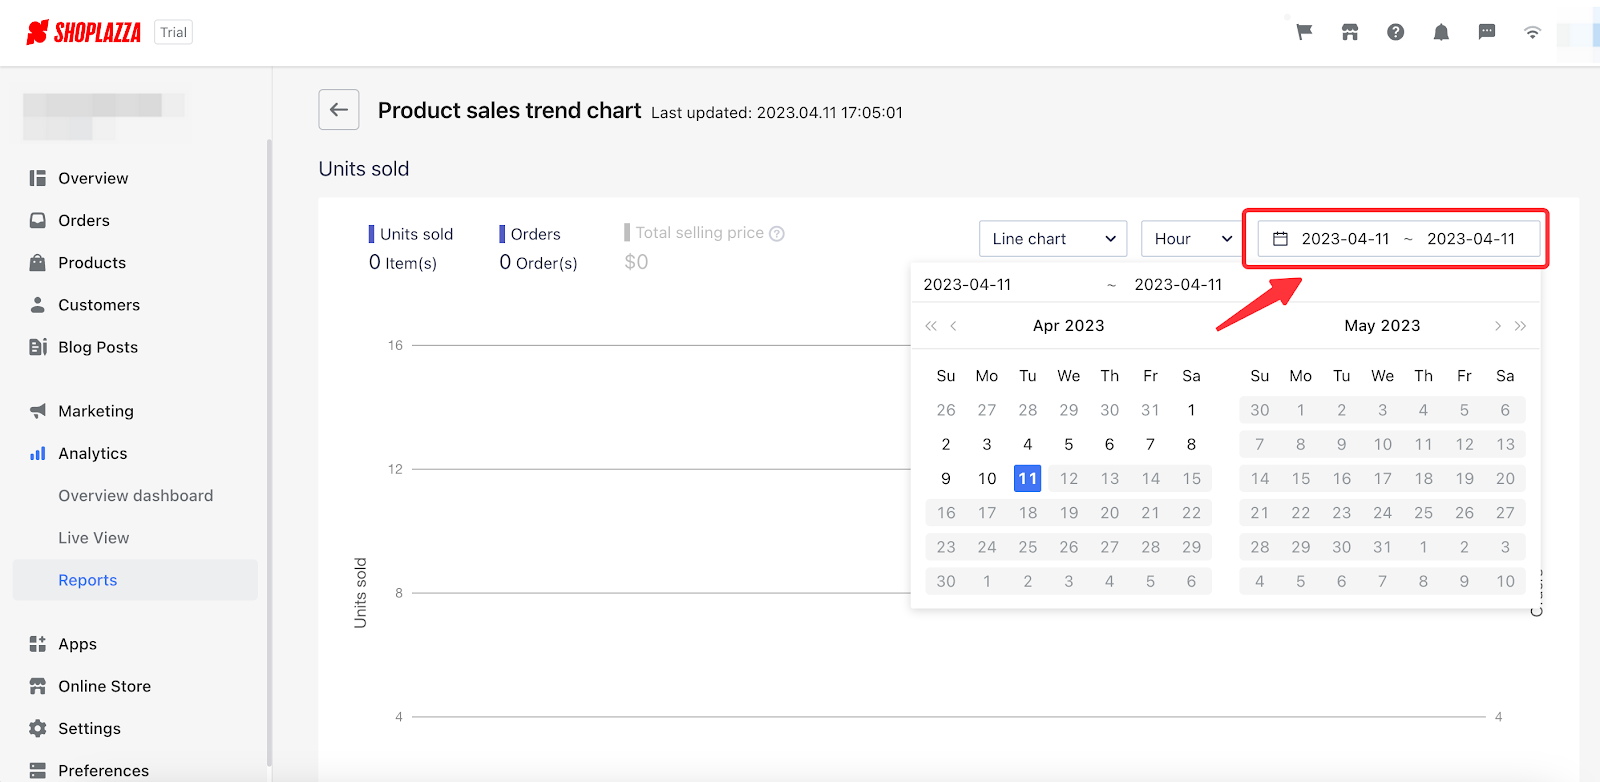
Note
The chart will automatically display today's data (from 0:00 am to the moment you click on the page).
Switching time measurement for the chart
Click on the measurement column to change the time range. (For example, you can use Day as the measurement.).
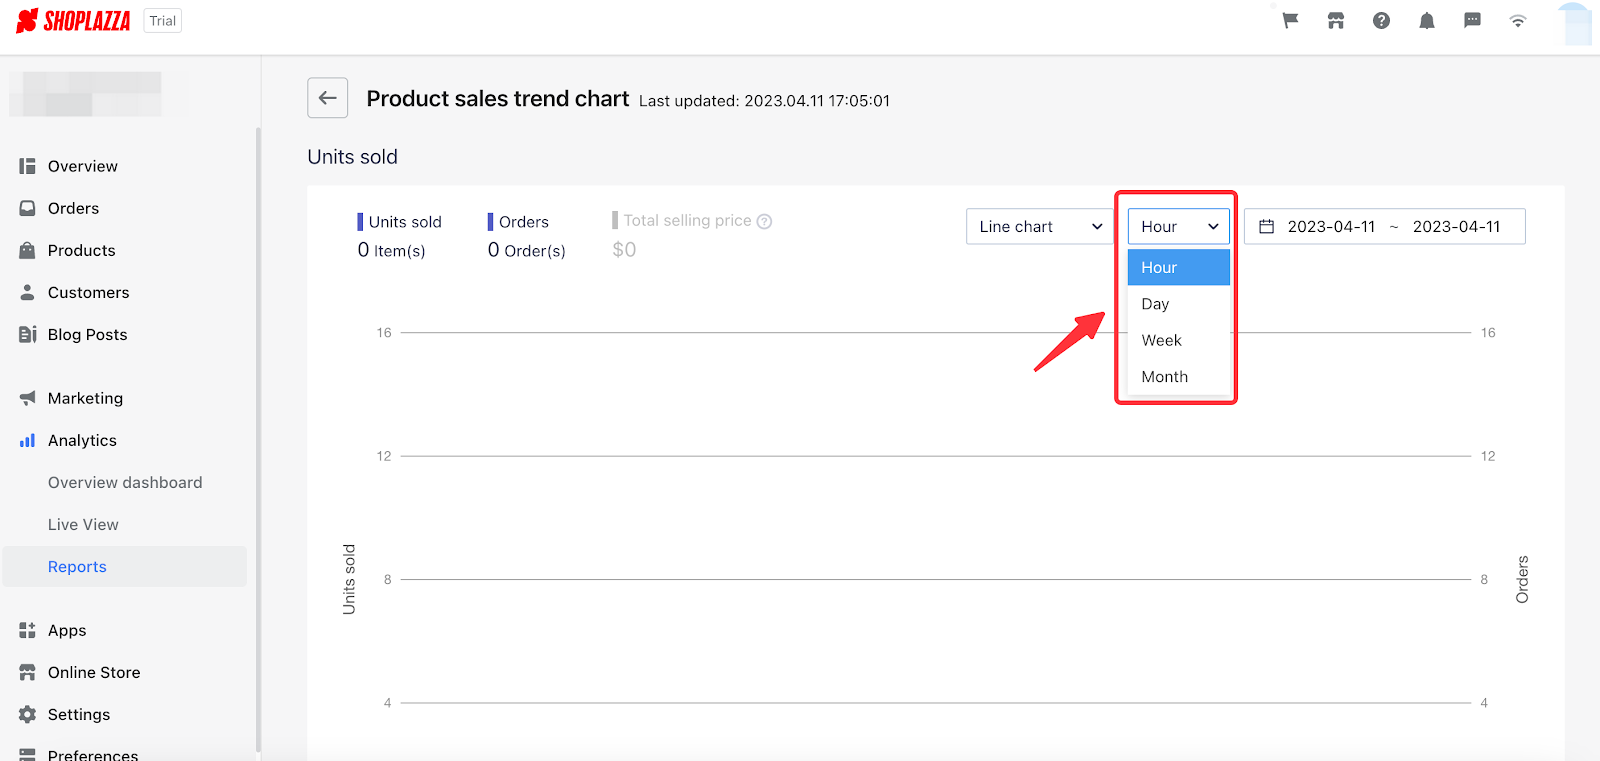
Note
The chart automatically measures data by hour.
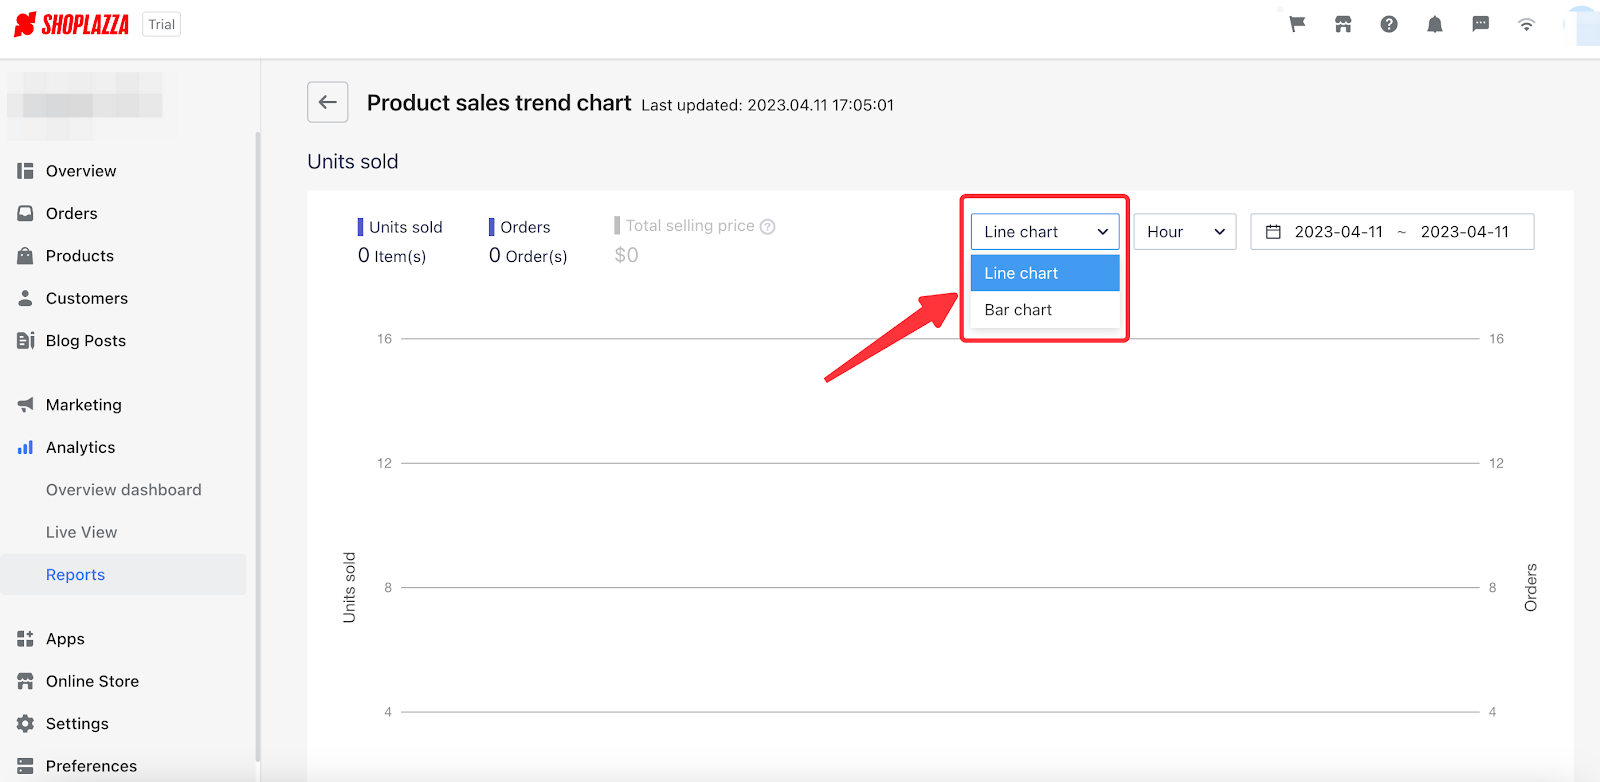
Changing the chart layout
The trend can be displayed in a line or bar chart.
(In a line chart, points in different locations stand for data. Connecting points with lines shows the changes in data. In a bar chart, bars of different heights stand for data. Arraying bars in the chart shows the difference in data.)
Note
The trend is automatically displayed in a line chart.
Switching the indicators displayed in the chart
Click on a specific indicator to display/fold it.
Note
- The chart shows one indicator at least and two indicators at most.
- Trend chart shows a double y-axis with two different indicators.
In the chart below, you can identify the meanings of every indicator in the Product Sales Trend Chart:
| Indicators | Definitions |
| Units Sold | Total number of products sold |
| Orders | Total number of completed orders |
| Total Selling Price | Total sales of a product |
| Total Quantity Added-to-cart | Total number of products being added to cart |
| Total Pageviews | Total number of views on product details |
Trend charts in Shoplazza admin analyze sales trends on views, add-to-charts and sales. Those three standards straightforwardly demonstrate the shopping tendencies of your potential customers. Analyzing data on those subjects will help you focus on customer's interests in a progressive way.

Comments
Please sign in to leave a comment.