
The purpose of a collection page is to make it easier for customers to browse and discover products that are related to or fit a specific category, helping them find what they're looking for more efficiently. For example, clothing store owners may create summer collections to display their new summer clothing in their stores.
In your Shoplazza Admin, you have access to a helpful tool called the 'Collection Page Report.' This report provides valuable information about your collection pages, such as the number of views, the quantity of products added to the cart, and the total number of orders placed. By keeping an eye on this data, you can optimize the arrangement of your products on the collection pages, make better product recommendations, and gain valuable insights to enhance your marketing strategy.
Viewing your collection page report
To access the collection page report, follow these steps:
1. In your Shoplazza Admin, navigate to Analytics > Report > Behavior > Collection Page Report.

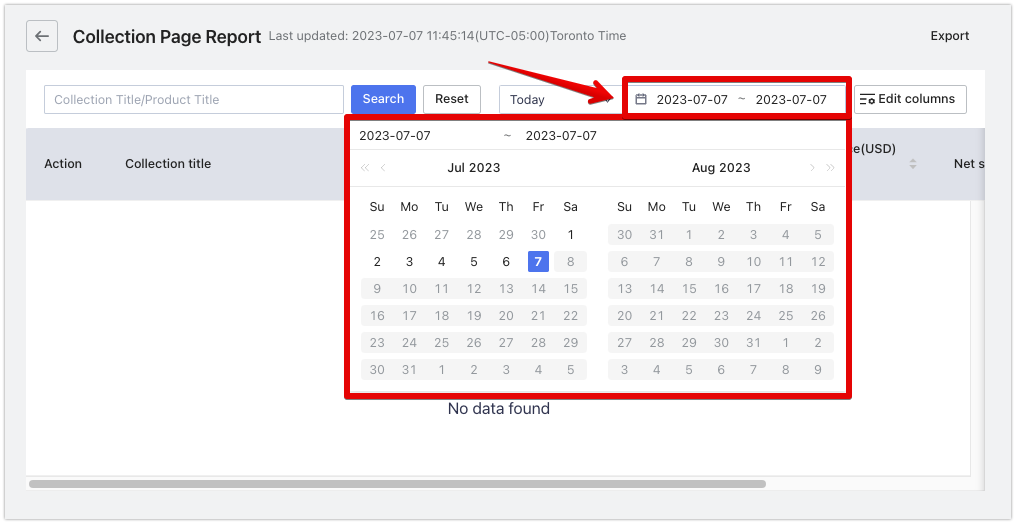
2. By default, you will see today's data for the report starting at 12:00 AM. You can personalize your collection page report in two different ways: either select the time indicator by clicking on the date column or choose the custom option from the drop-down menu.

3. Utilize the search bar to view the report of a specific collection in your store. You can also type the name of a product in the search bar to view the report of the collection that the searched product belongs to.

Sorting your data in your report
1. Click on the arrows beside the headers to sort your search results by ascending or descending orders in the chart. (For example, clicking on the arrows beside the header Orders and making the arrows go up will sort out the number of orders in ascending order. Conversely, arrows going down will sort out the list of orders in descending order.)

2. If you wish to customize the headers displayed in the chart of your reports, you can easily do so by editing the columns by clicking Edit columns.

3. Enable indicators by checking the boxes to include information displayed in the report.

4. Drag the buttons beside the indicators to reorganize how the report is presented to you. Use the Apply button to save the organization of your columns. You can also click on the Reset to default settings button to restore the default layout of the chart.

Updating your collections
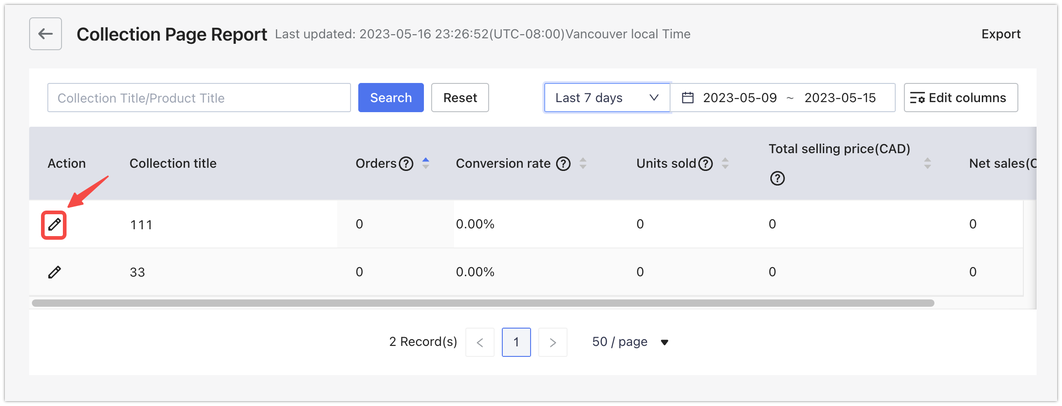
In addition to viewing your collection reports, you can also update your collections on the editing page. This allows you to refresh your collection with new products, remove outdated items, or adjust the categorization to better fit your store's offerings. By regularly updating your collections, you ensure that your customers have access to the latest and most relevant products, keeping their browsing experience fresh and exciting.
To make updates to your collections, click on the pencil icon next to the collection title.
Exporting collection page report
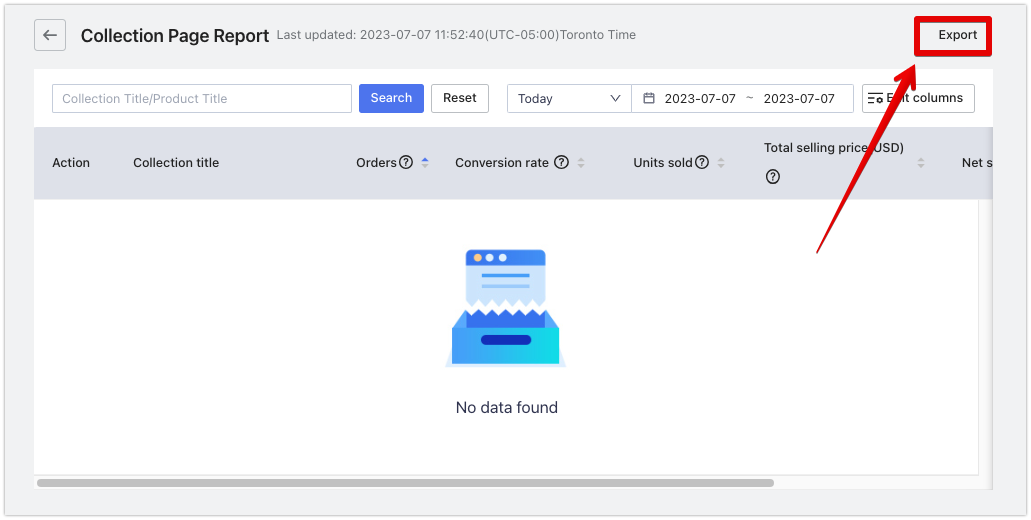
By exporting your report, you can obtain a comprehensive snapshot of important data and metrics related to that specific page. Additionally, exporting the report lets you view the report offline, allows you to access the data offline, make adjustments and seamlessly integrate it with other tools for better reporting and decision-making.
To save a copy of your page report, click on the Export button located on the right.
The chart below provides a comprehensive overview of each header title in your collection page report, helping you understand their respective meanings:
| Header Titles | Definition |
| Collection title | The name or the title of your product collection. |
| Orders | The total order quantity refers to the number of successful orders placed by users who have completed the final two steps of the browsing path on the collections page. These steps involve adding selected items from the collections to the shopping cart and proceeding to the checkout process. |
| Conversion rate | The percentage of visitors to the collection who completed a purchase. |
| Units sold | Units sold refers to the total number of products included in the successful orders that have passed through the collection page during the last two steps of the browsing path. These steps involve adding selected items from the collection page to the shopping cart and completing the order placement process. |
| Total selling price | The cumulative value of all products sold within the collection, in USD. |
| Net sales (USD) | The total revenue generated from sales within the collection, after accounting for any discounts. |
| Product title | The title or name of the specific product within the collection. |
| Pageview | The total number of times the product page within the collection was viewed by visitors. |
| Add-to-cart count | Add-to-cart count refers to the total number of times products from the collection page have been added to the shopping cart during the last two steps of the browsing path. These steps occur when users select items from the collection page and proceed to the shopping cart as part of the order placement process. |
| Proportion of pageview | The percentage of total pageviews that the specific product within the collection received. |
| Proportion of add-to-cart | The percentage of add-to-cart actions for a specific product compared to the total add-to-cart actions across all products within the collection. |
| Total visitors | The total count of unique visitors who accessed the collection or viewed products within the collection. |
| Added to cart | The number of times products within the collection were added to the shopping cart by visitors. |
| Collection created at | The date and time when the collection was initially created or established. |
Note
Metrics will not be counted if items were not added from a collection.


Comments
Please sign in to leave a comment.