When you enable the sales pop on your store, you can analyse its results through the data report. By viewing the data, you can evaluate the influence of the sales pop notification on orders placed and its impact on driving sales for your store. This article walks you through the basic steps of viewing your sales pop data.
Steps
1. Head over to Shoplazza Admin > Marketing > Sales pop.

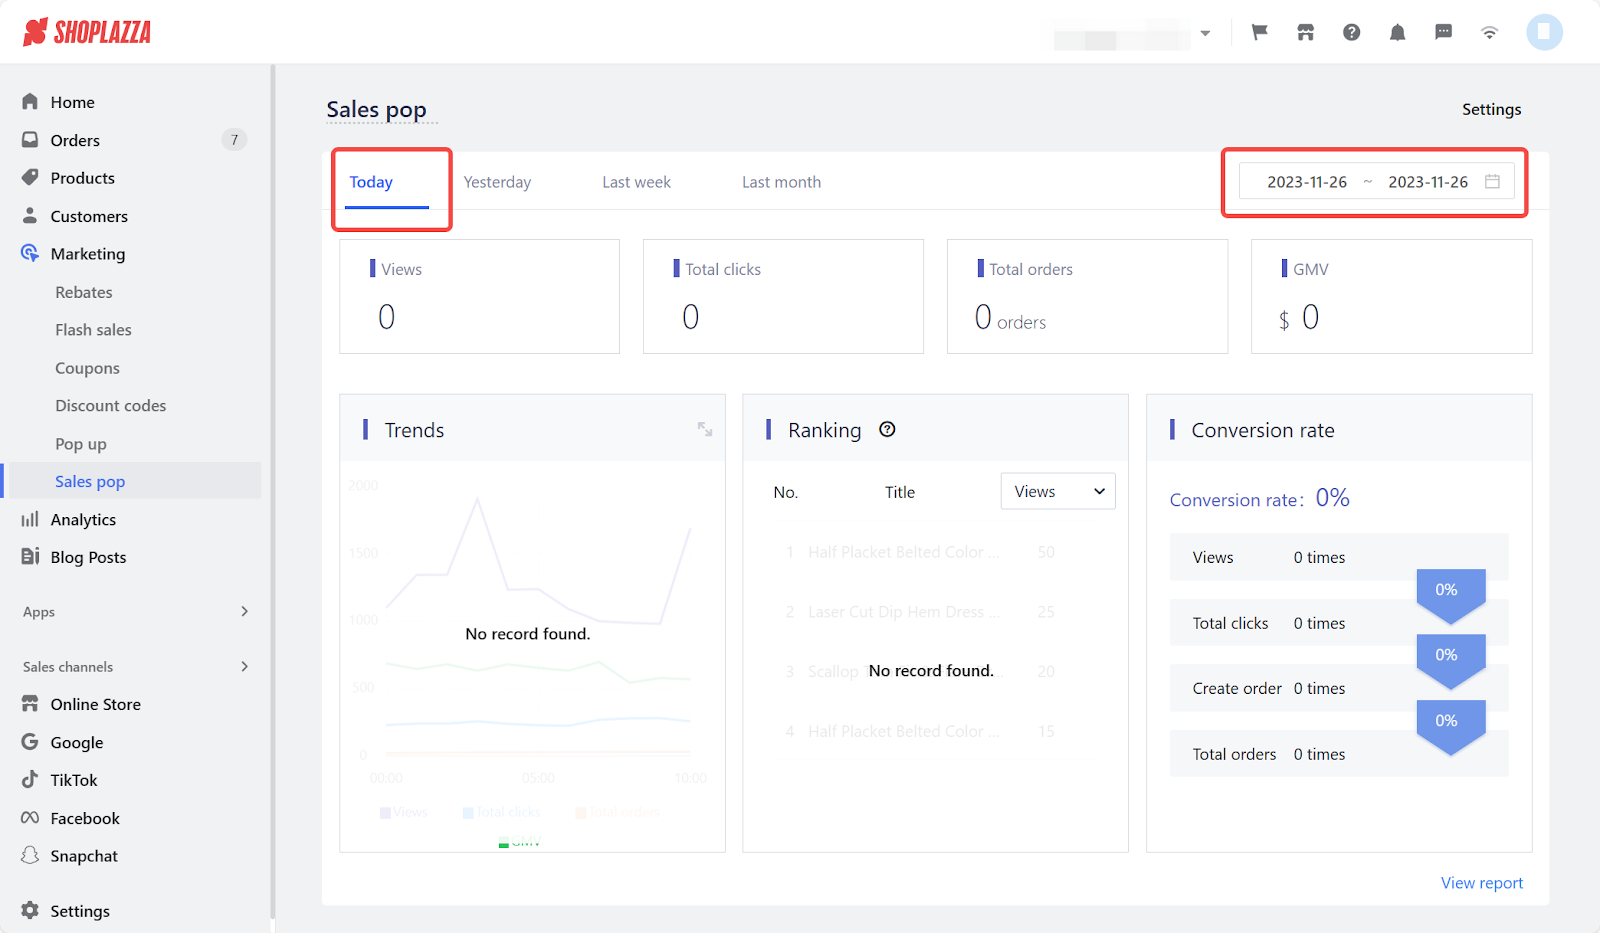
2. View the sales pop data for today, yesterday, last week, and last month, or just select a specific date.

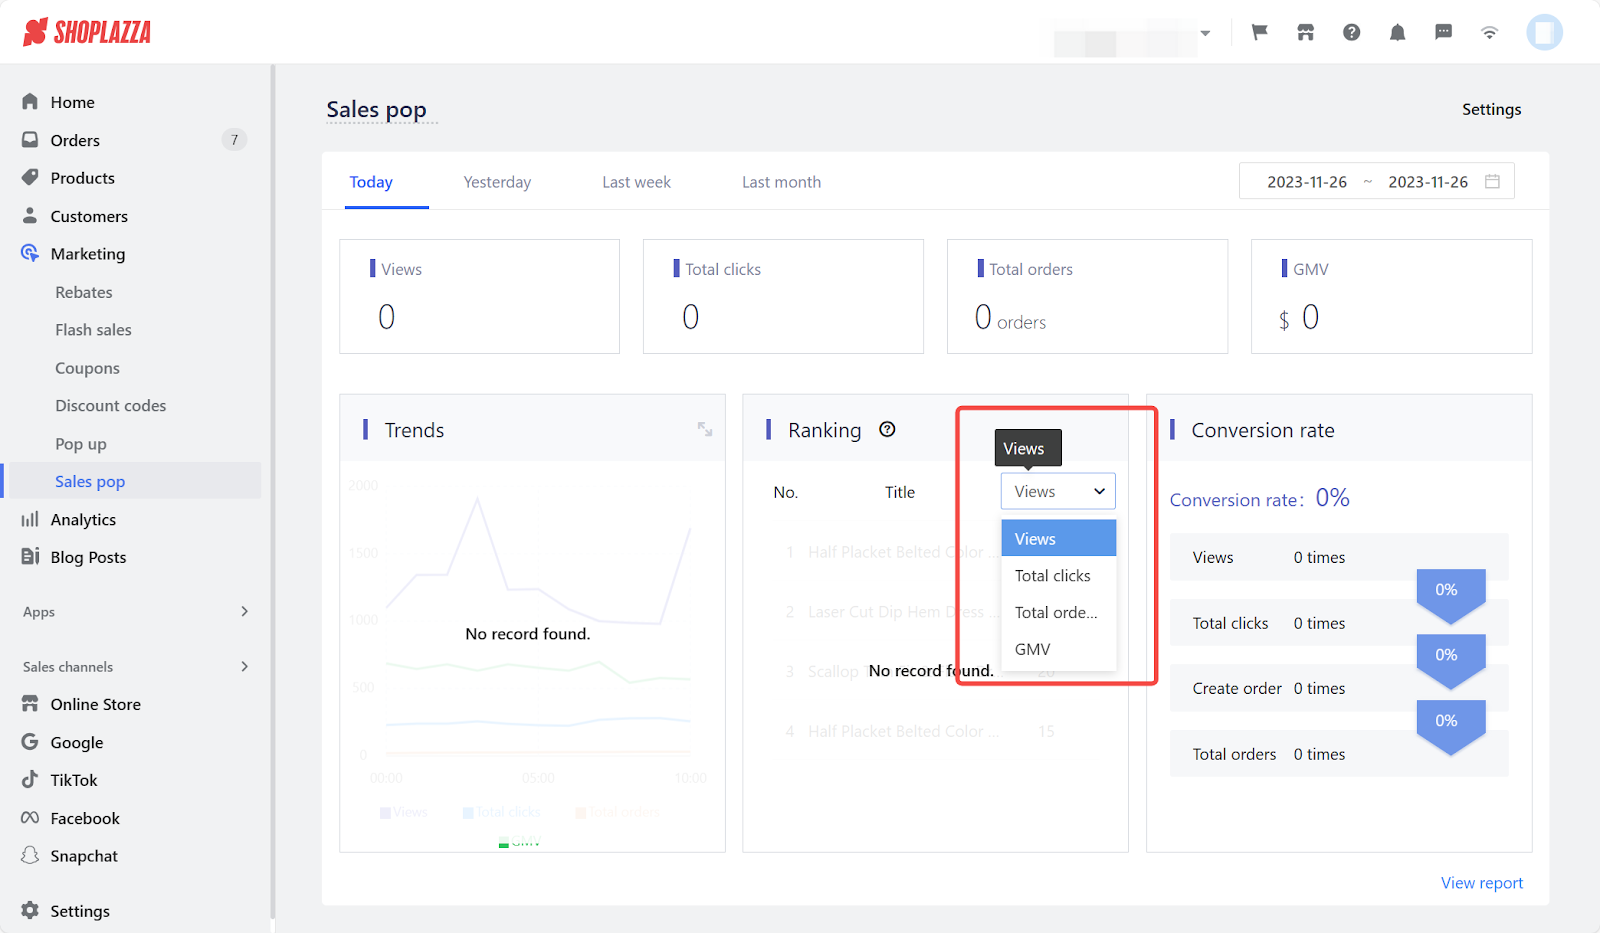
3. In the Ranking column, you can sort according to the number of views, Total clicks, Total orders, and GMV(Gross Merchandise Volume).

4. In the Conversion rate column, you can see the converted percentage of Views, Total clicks, Create order, and Total orders.

5. Click View report at the bottom of this page to see the relevant data of the sales pop.

6. Enable/disable the sales pop for the respective product, and by clicking All, you can select the scheduled and active sales pop from the drop-down.
Note
Transaction conversion rate equals the number of paid orders divided by the number of views and multiplied by 100%.
By viewing the sales pop data, you can keep track of your sales and adjust your inventory accordingly. It will also help you analyse sales trends and assist in identifying high-performing products and peak selling times.


Comments
Please sign in to leave a comment.