Dispute Data Dashboard is a dynamic visual analytics platform that provides real-time display of key health metrics such as dispute rate, number of disputes, and dispute amount.
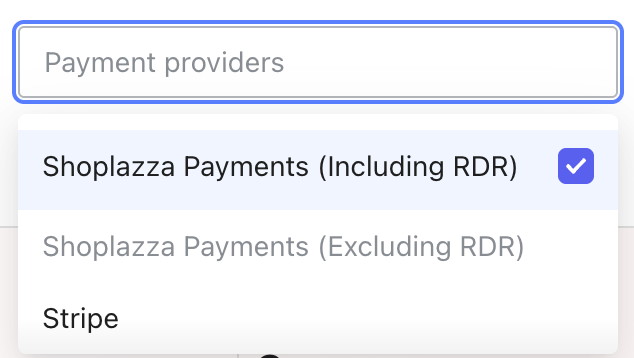
Payment Service Provider Filter: Displays providers that have historically generated dispute orders.
If the merchant has enabled RDR (Dispute Prevention) and has generated dispute order data processed by RDR, the dropdown will include two mutually exclusive options: "Shoplazza Payments (Including RDR)" and "Shoplazza Payments (Excluding RDR)".
Shoplazza Payments (Including RDR): Filters dispute order data to include orders processed by RDR.
Shoplazza Payments (Excluding RDR): Filters dispute order data to exclude orders processed by RDR.
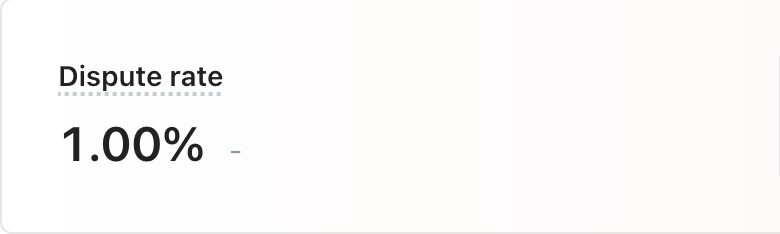
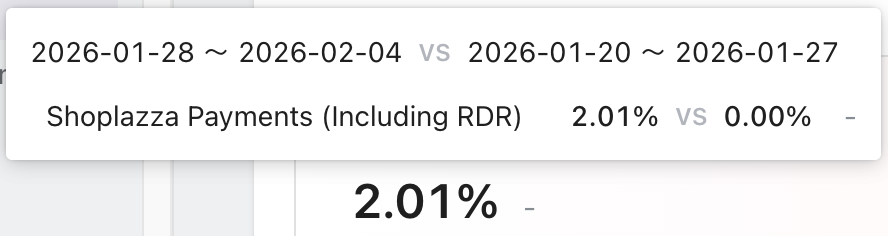
Dispute Rate: Calculated based on the selected time range and payment service provider.
Dispute Rate = (Number of Dispute Orders / Number of Successful Orders) × 100%.
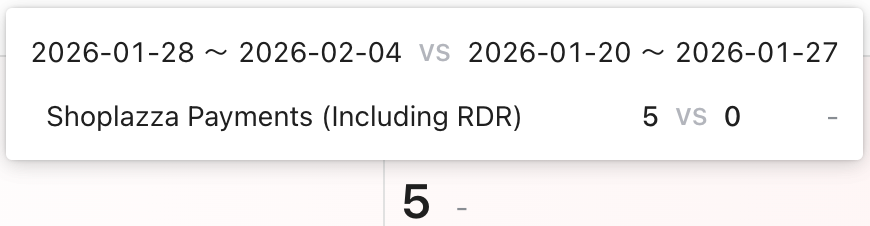
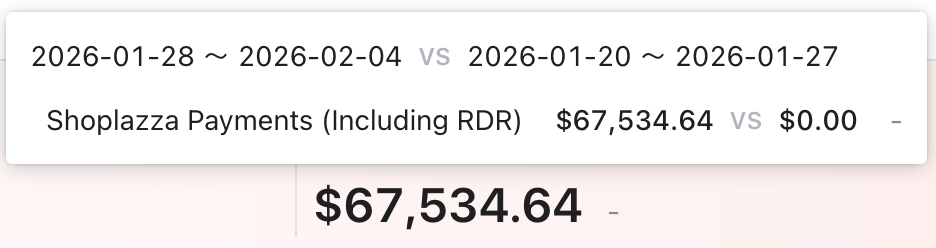
Hover over the number to view the period-over-period change data between the current and previous (e.g., if the current range is Jan 28, 2026 - Feb 04, 2026, the previous period is Jan 20, 2026 - Jan 27, 2026).
Growth Rate = (Current Period Value - Previous Period Value) / Previous Period Value × 100%.
Number of disputes: Calculated based on the selected time range and payment service provider.
Hover over the number to view the period-over-period change data.
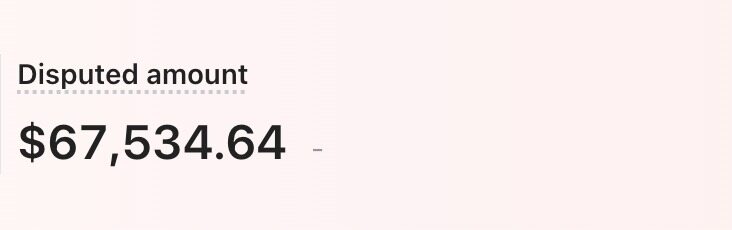
Disputed amount: Calculated based on the selected time range and payment service provider. Amounts are converted and totaled in USD for reference.
Hover over the number to view the period-over-period change data.
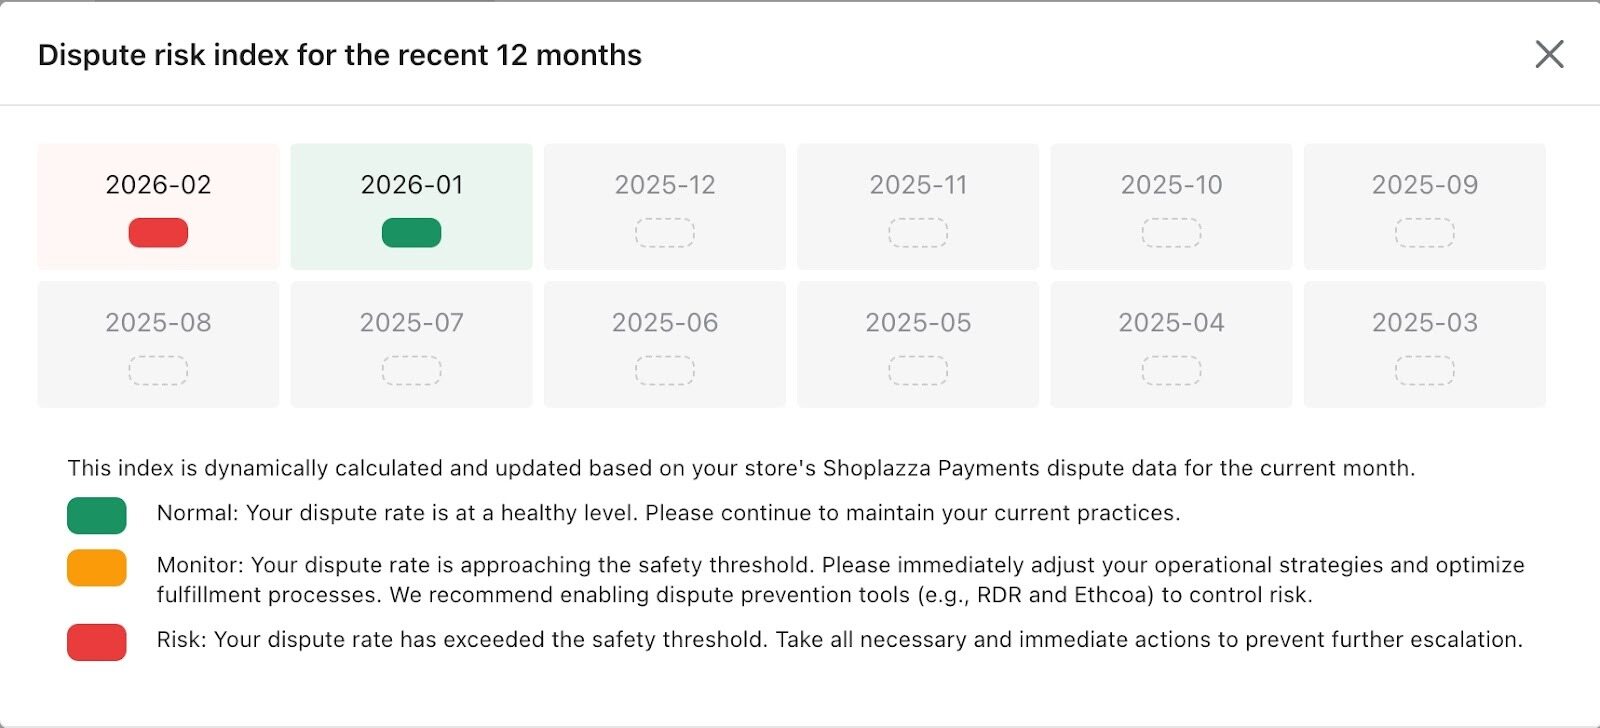
Dispute risk index: Dynamically calculated and updated based on the store's monthly Shoplazza Payments dispute data.
Normal: Dispute rate is at a healthy level. Please maintain current practices.
Monitor: Dispute rate is approaching the safety threshold. Immediately adjust operational strategies and optimize fulfillment processes. Enabling dispute prevention tools (e.g., RDR, Ethoca) is recommended for risk control.
Risk: Dispute rate has exceeded the safety threshold. Take all necessary measures immediately to prevent further escalation.
Dispute risk index for other payment service providers is assessed by the respective providers.
Displays the change trend of the Dispute Risk Index over the past 12 months. If Shoplazza Payments was not enabled in the current month, this section will be empty.
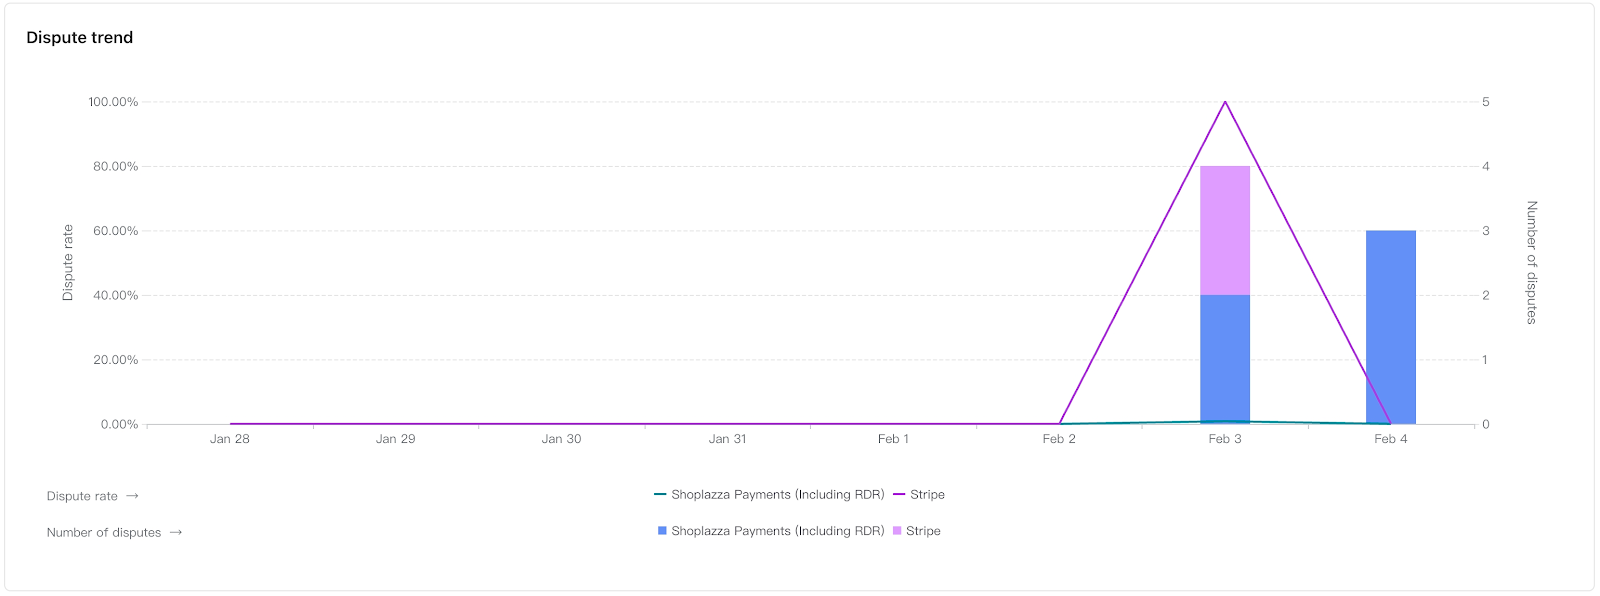
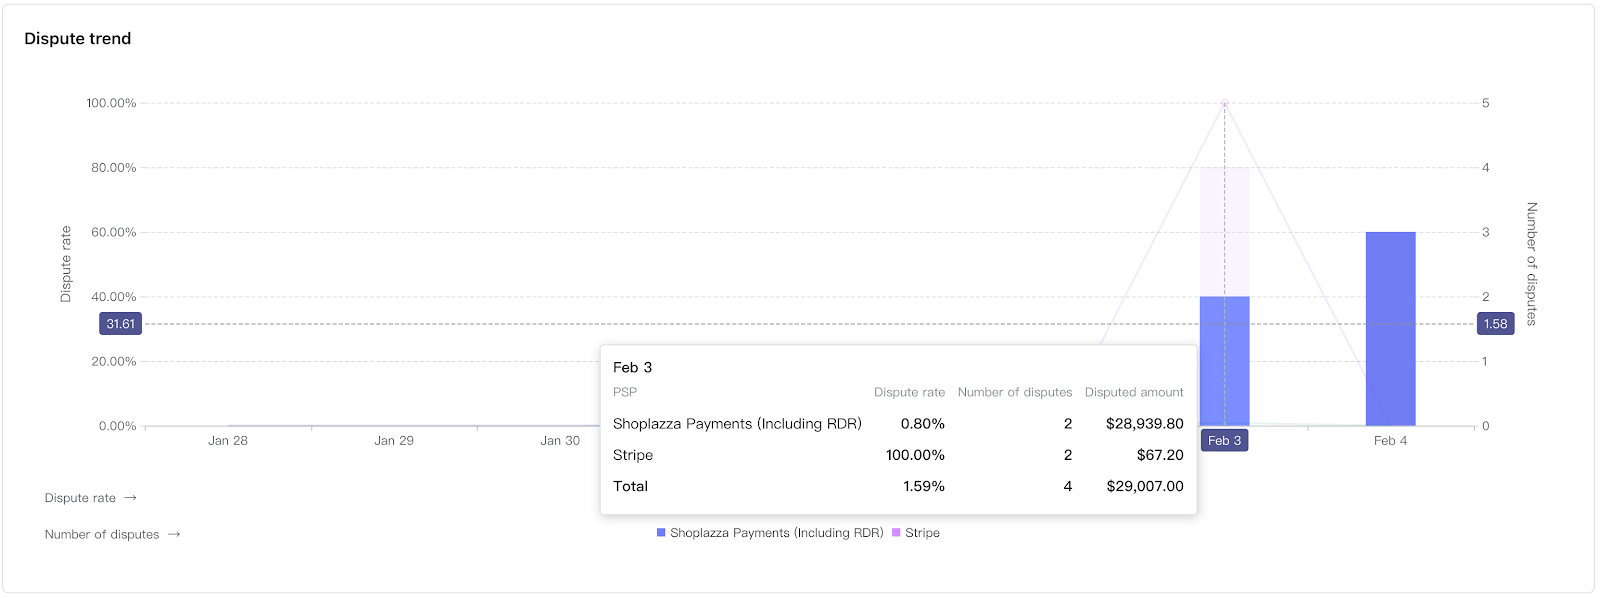
Trend Chart: Shows the trend of dispute data for each service provider within the selected time range and filter. The line represents the dispute rate, and the bars represent the dispute count.
Hover over the chart to view the dispute rate, dispute count, and dispute amount statistics for each service provider at that specific time point.
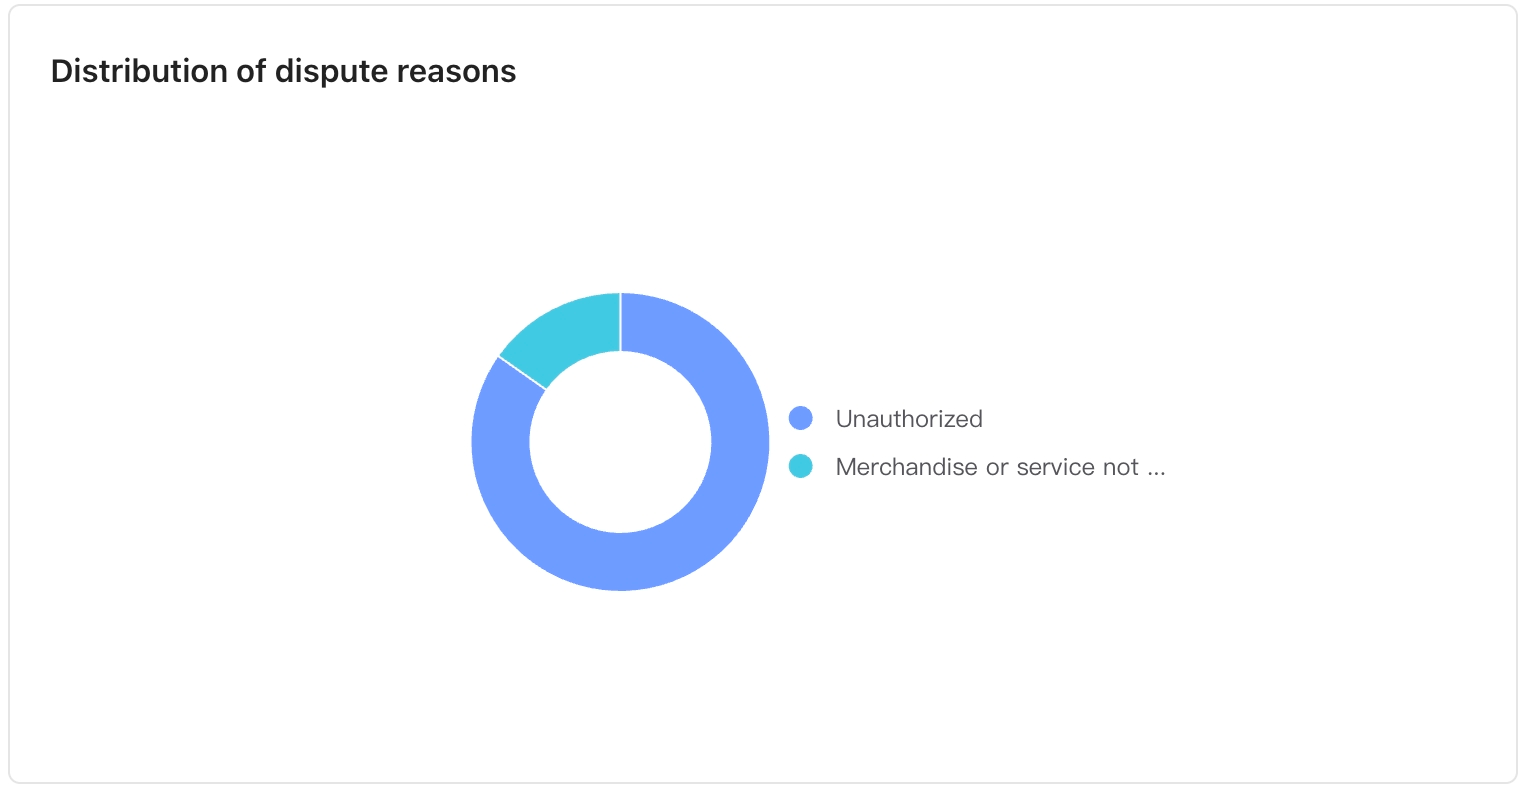
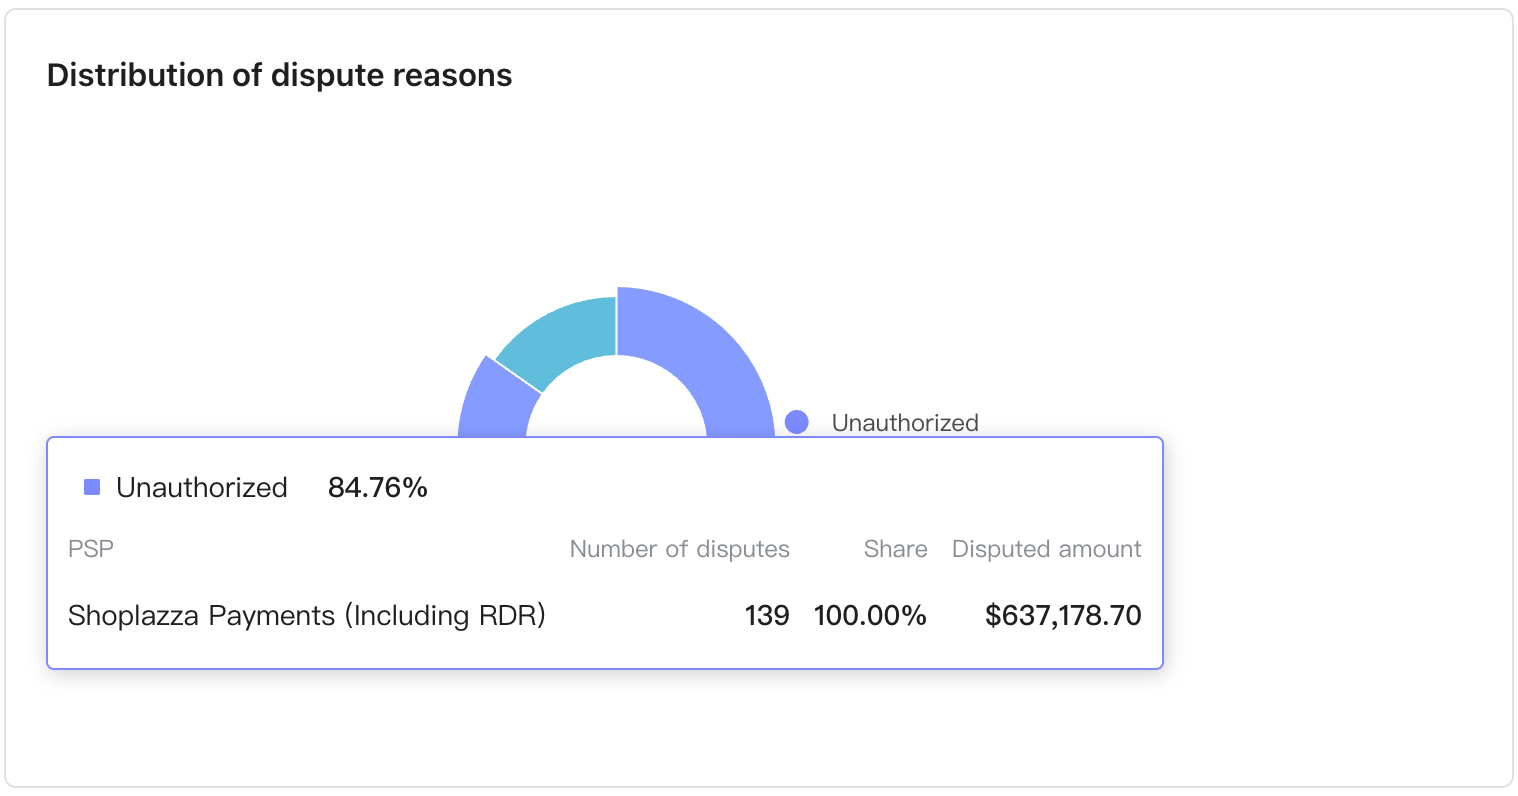
Dispute Reason Distribution: Shows the percentage distribution of various dispute reasons based on the selected time range and payment service provider.
Hover over a segment of the pie chart to view the dispute rate, dispute count, and dispute amount statistics for each service provider within that reason category.
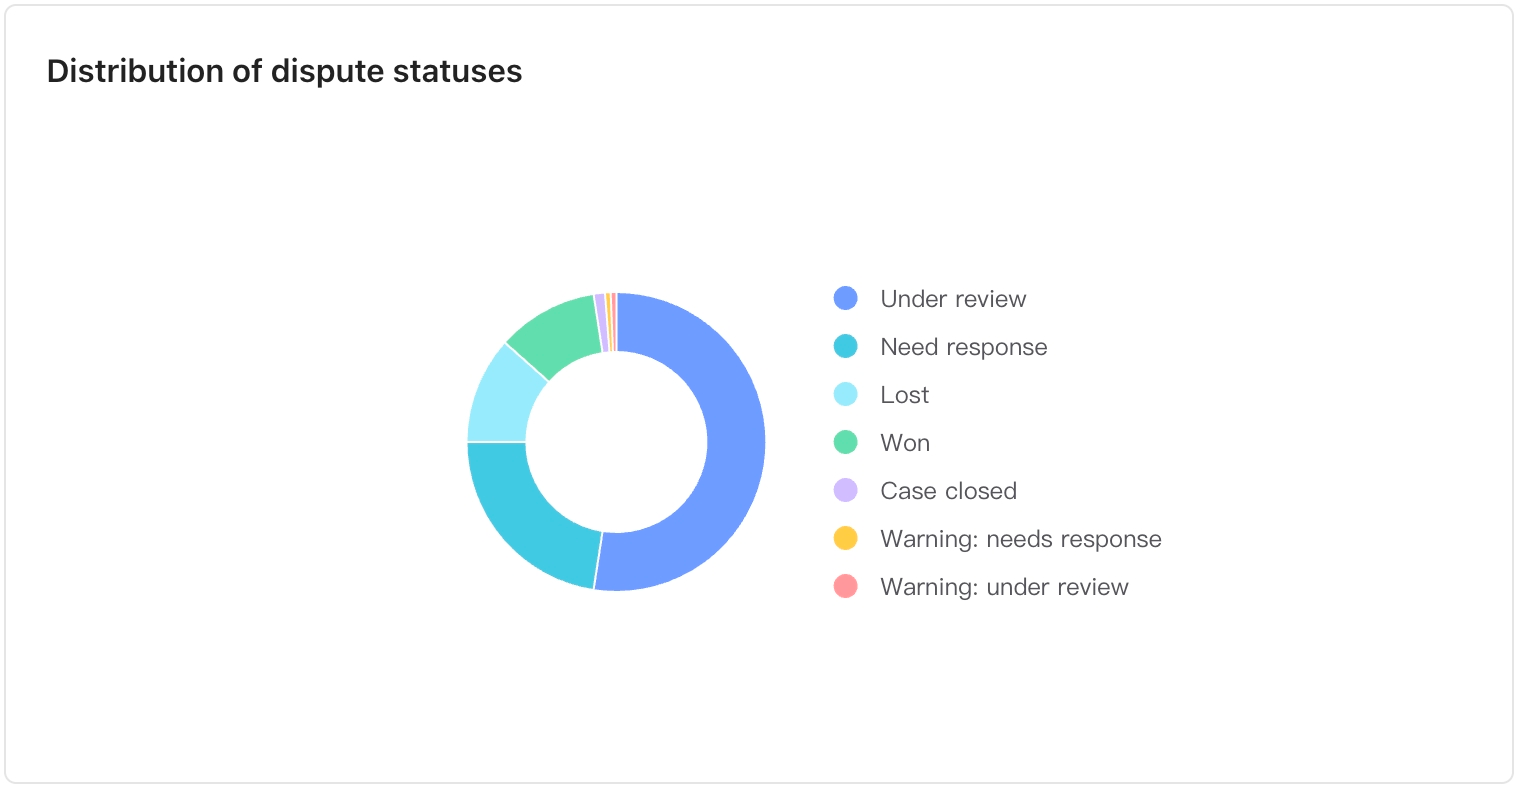
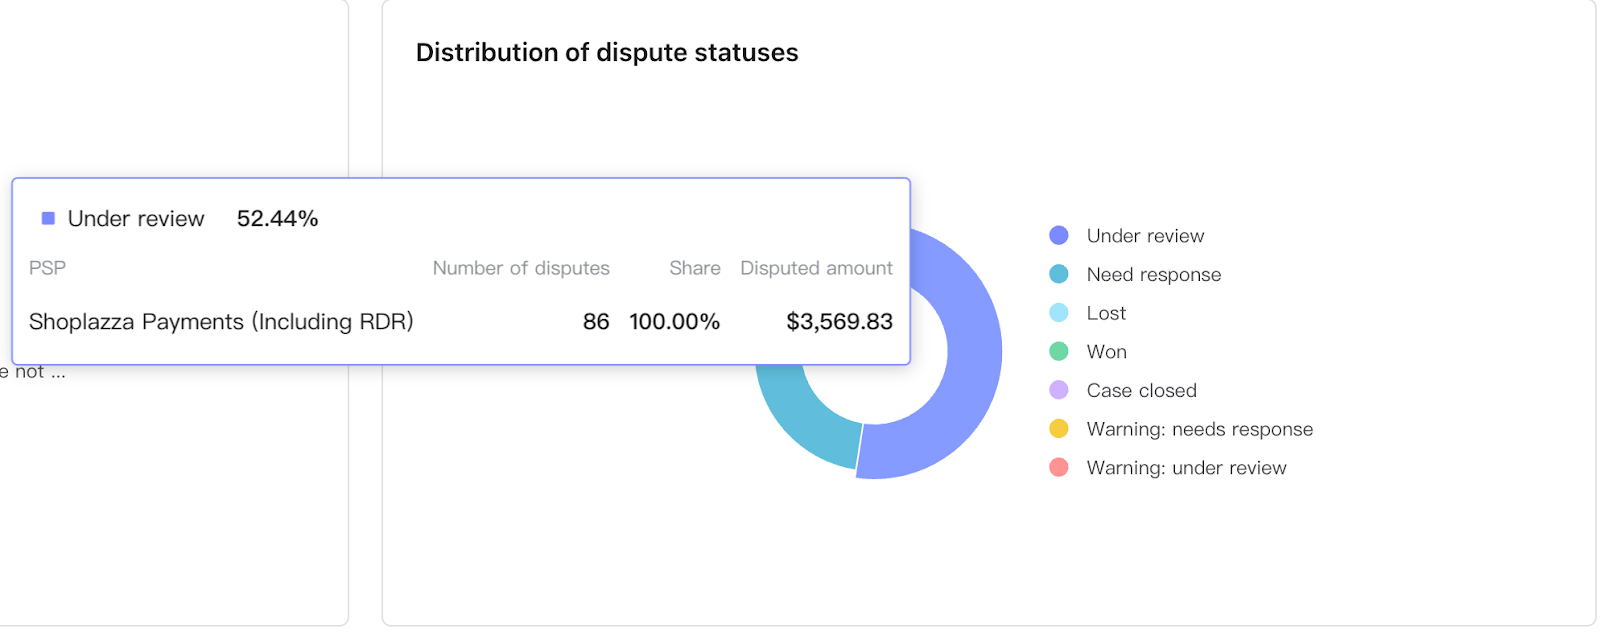
Dispute Status Distribution: Shows the percentage distribution of various dispute statuses based on the selected time range and payment service provider.
Hover over a segment of the pie chart to view the dispute rate, dispute count, and dispute amount statistics for each service provider within that status category.


Comments
Please sign in to leave a comment.