
The Usage Report tab helps you track how your try-on features are performing. It provides a detailed view of product activity, engagement trends, and remaining capacity under your current subscription plan. Use this section to monitor store performance and identify high- and low-performing SKUs.
Access the Usage Report tab
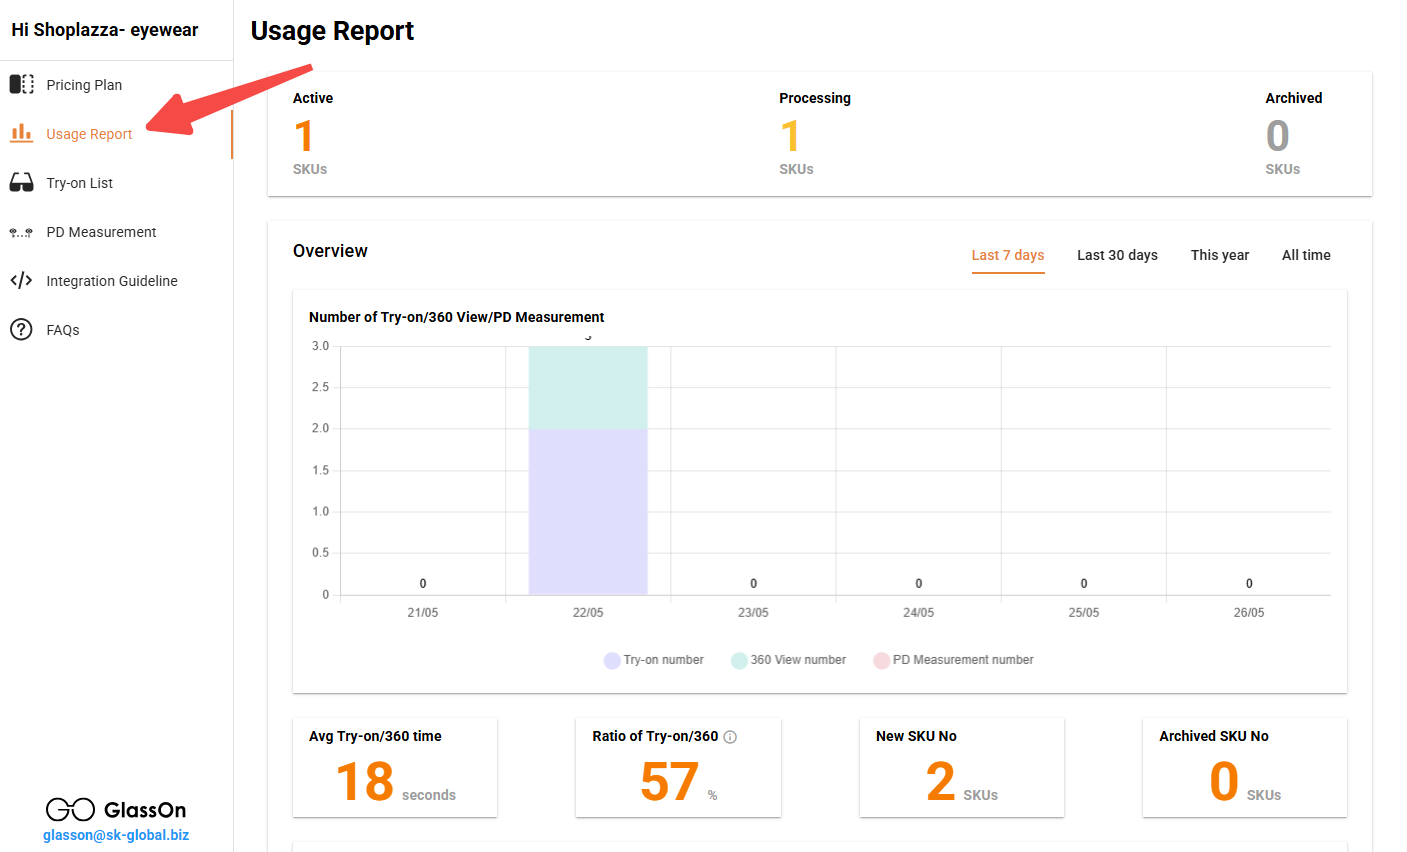
1. Go to the Usage Report tab: In the GlassOn app menu, click Usage Report. This will open a dashboard that summarizes product-level usage and historical engagement.
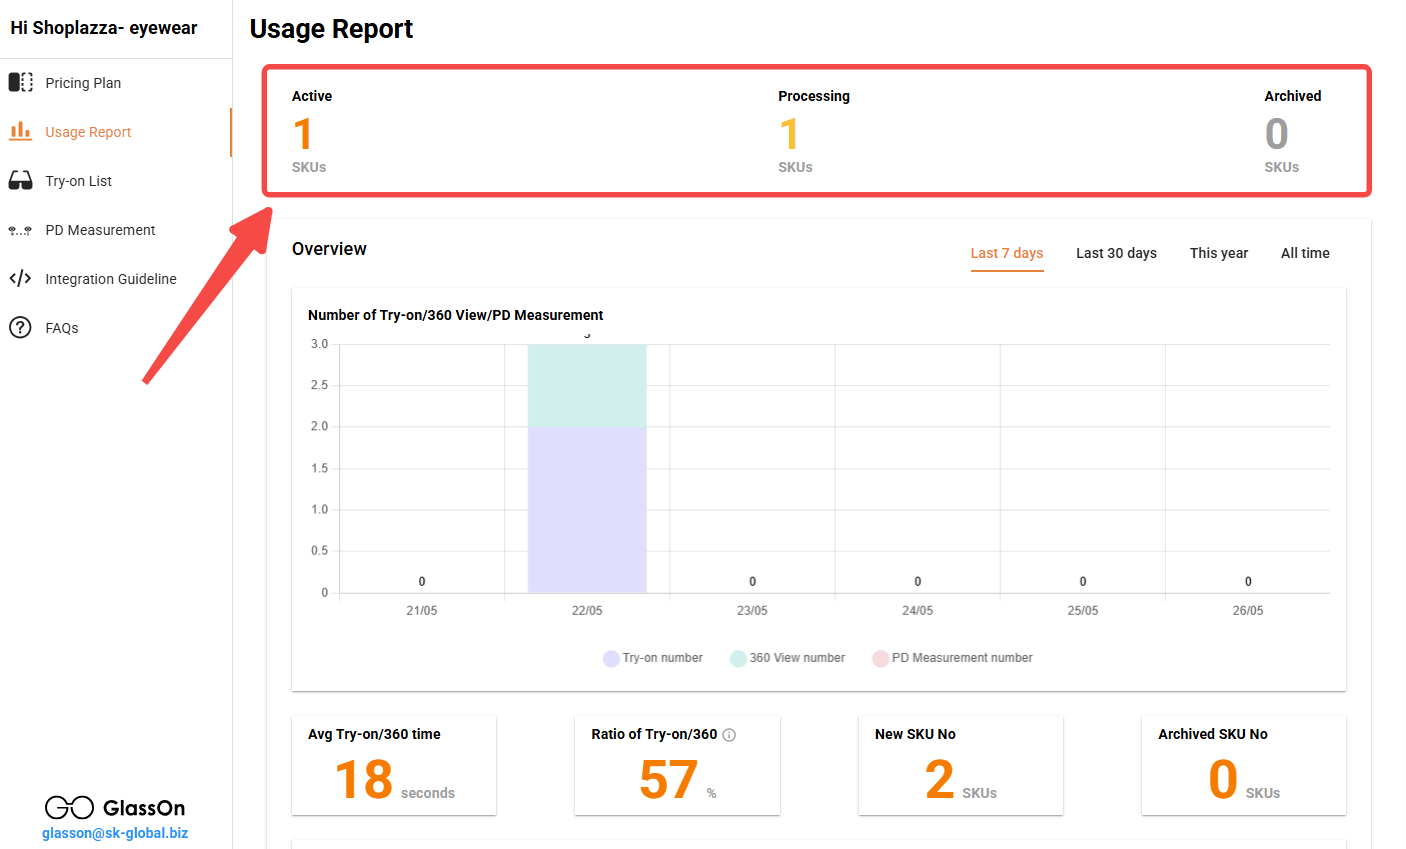
2. Check product status summaries: At the top of the tab, you’ll see counters showing the number of products in each state:
- Active: The number of products currently live with try-on features enabled.
- Processing: The number of products still undergoing 3D model generation.
- Archived: Products that were previously active but are no longer in use.
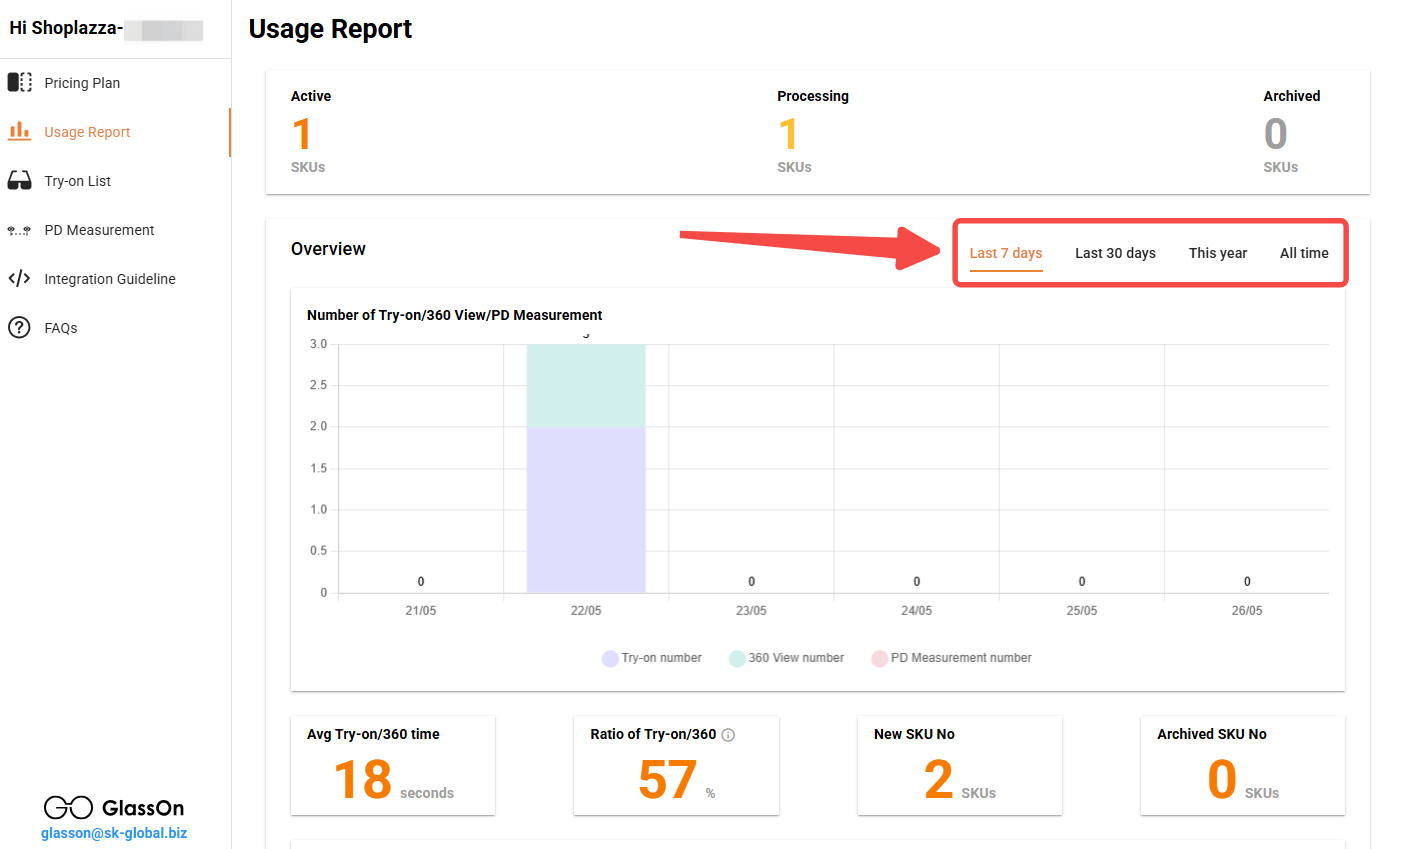
3. Filter the time range: Use the date filters above the chart to view usage data from the Last 7 days, Last 30 days, This year, or All time. This helps you compare short-term and long-term trends.
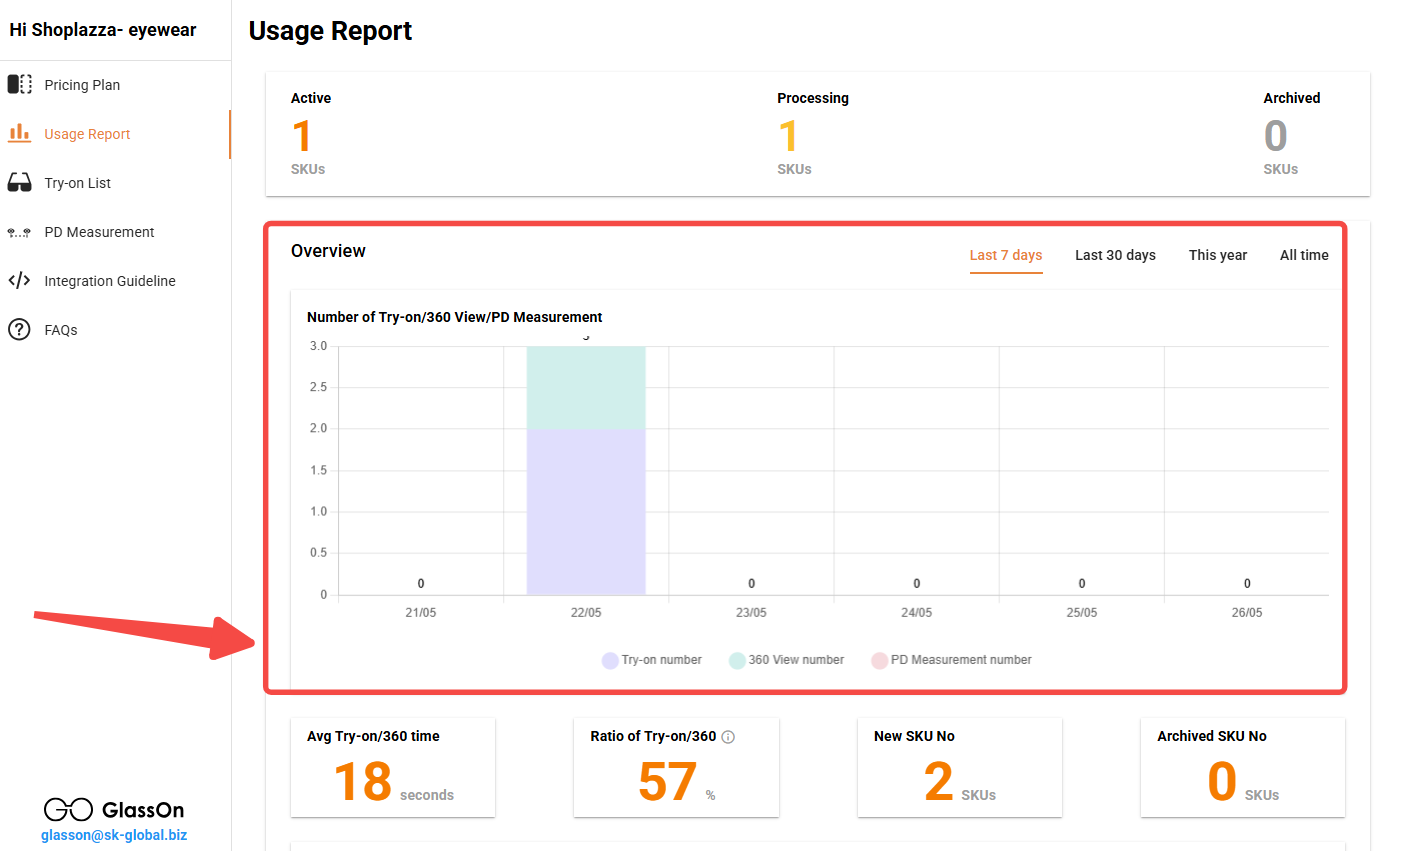
4. View the usage graph: Below the product summary, a line graph displays customer activity across three categories:
- Try-on: Number of try-on sessions initiated.
- 360 View: Number of times the 360° product viewer was used.
- PD Measurement: Number of customers who interacted with the PD tool.
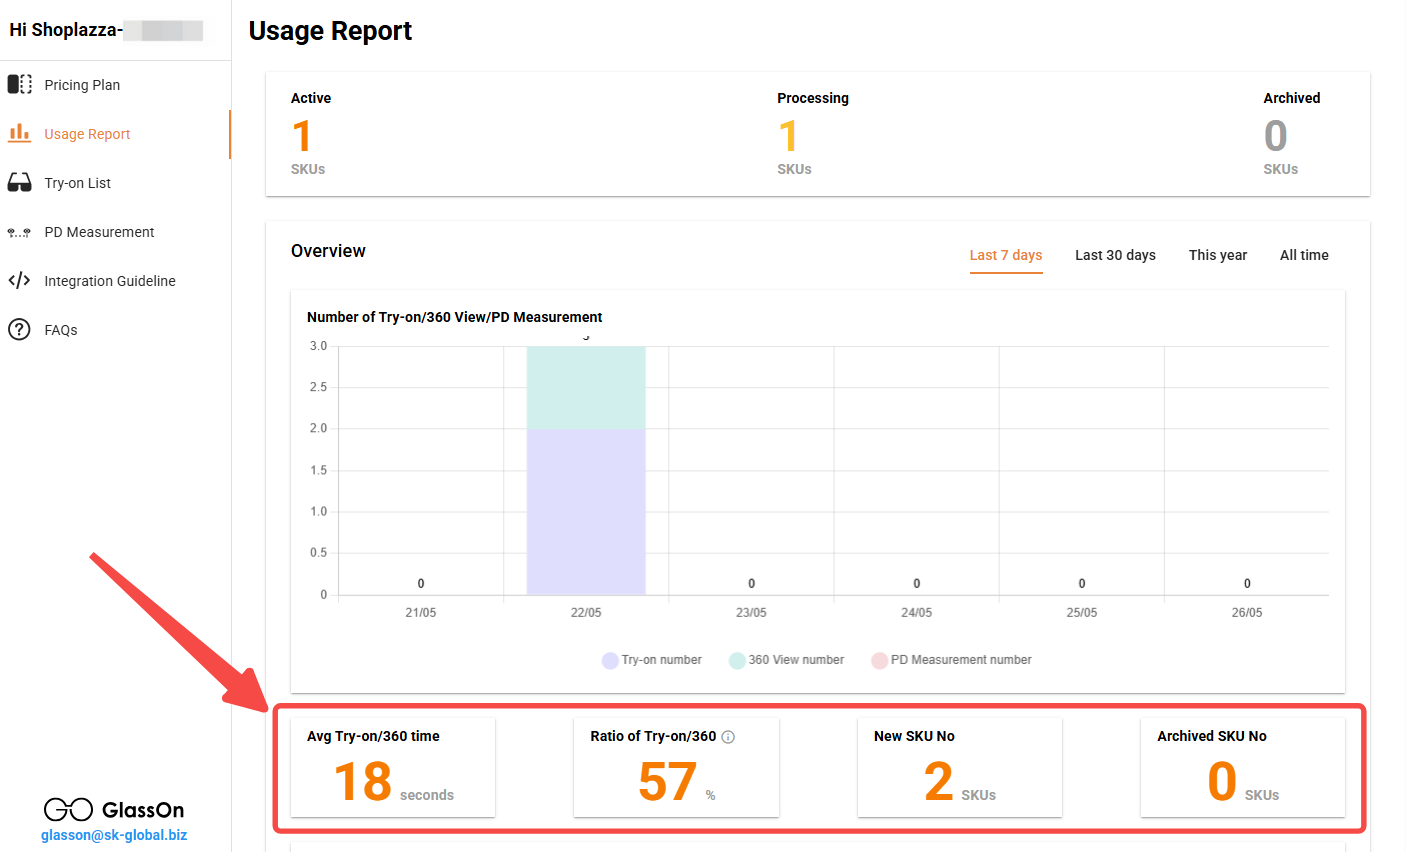
5. Analyze engagement metrics: Further down the page, GlassOn provides key engagement statistics that help you understand how customers are interacting with your products:
- Avg Try-on/360 time: The average time users spend using the try-on or 360° features.
- Ratio of Try-on/360: The percentage of visitors who click the try-on or 360° buttons compared to the total number of visits to that product.
- New SKU No / Archived SKU No: The number of new try-on products added or deactivated during the selected time period.
This report helps you decide which products to promote and find those that may need better photos or placement. It also shows when you might need to upgrade your plan to meet growing engagement demand. GlassOn’s usage report helps you track performance and engagement, so you can optimize product presentation, monitor growth, and adjust your try-on strategy with confidence.


Comments
Please sign in to leave a comment.