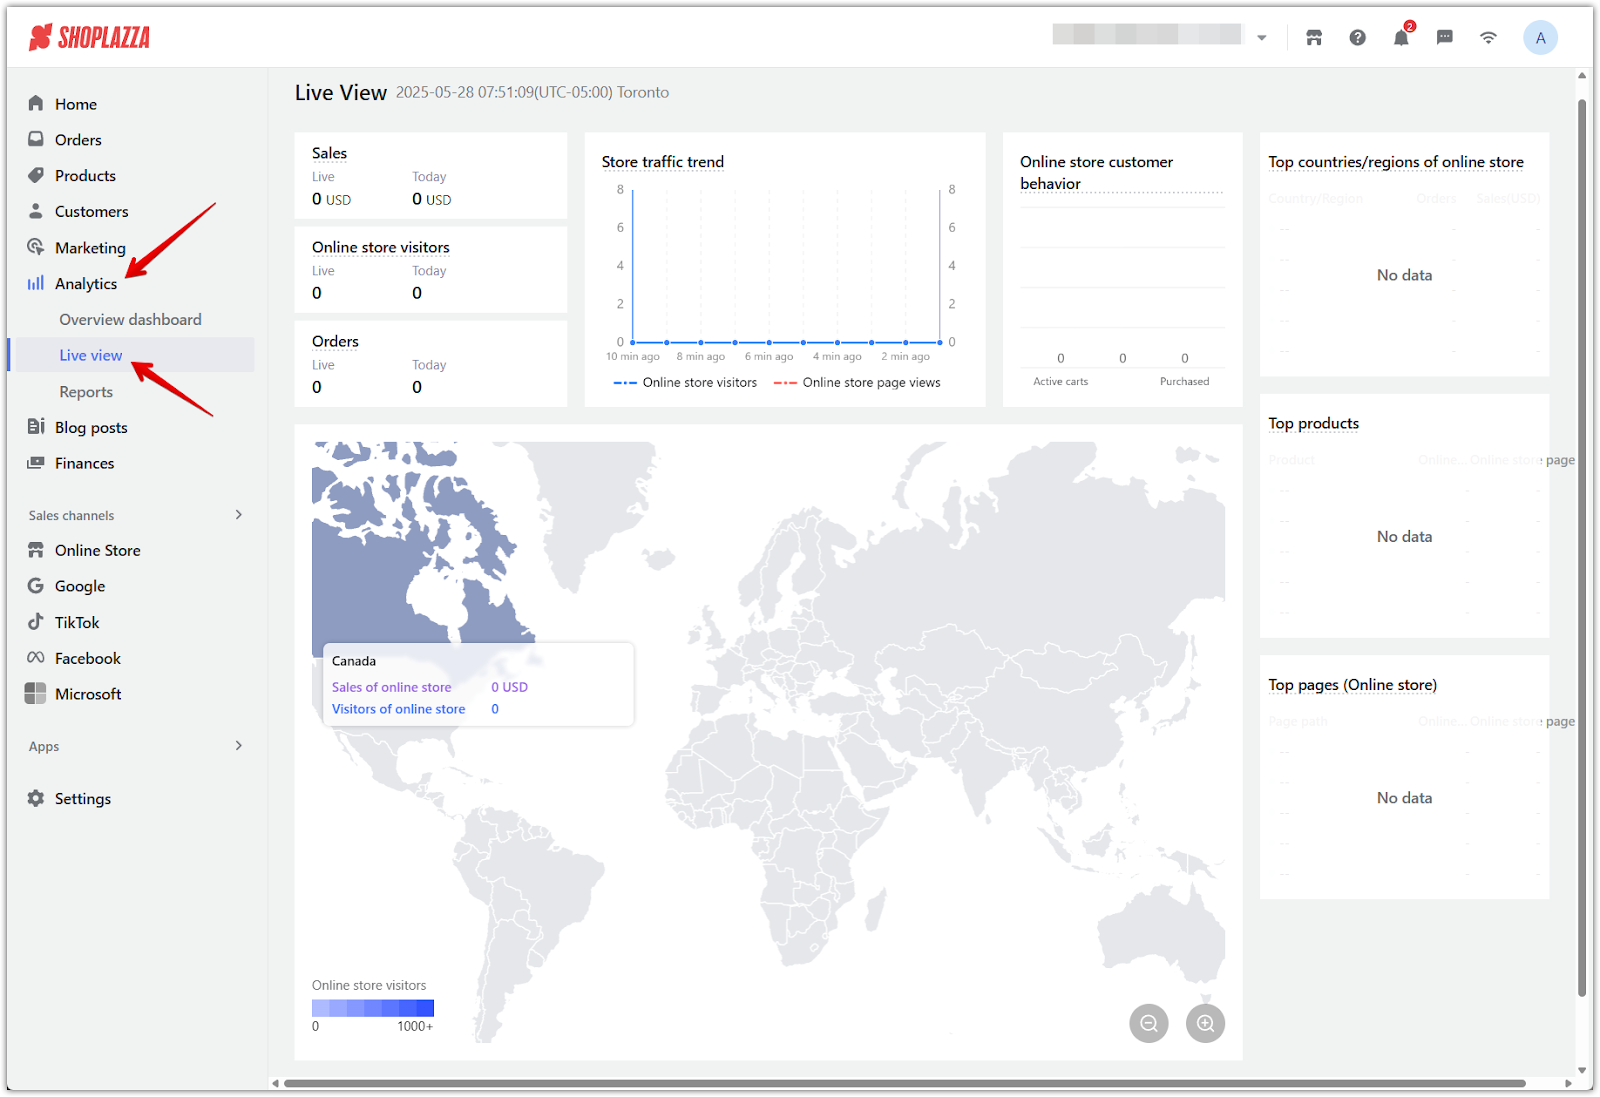
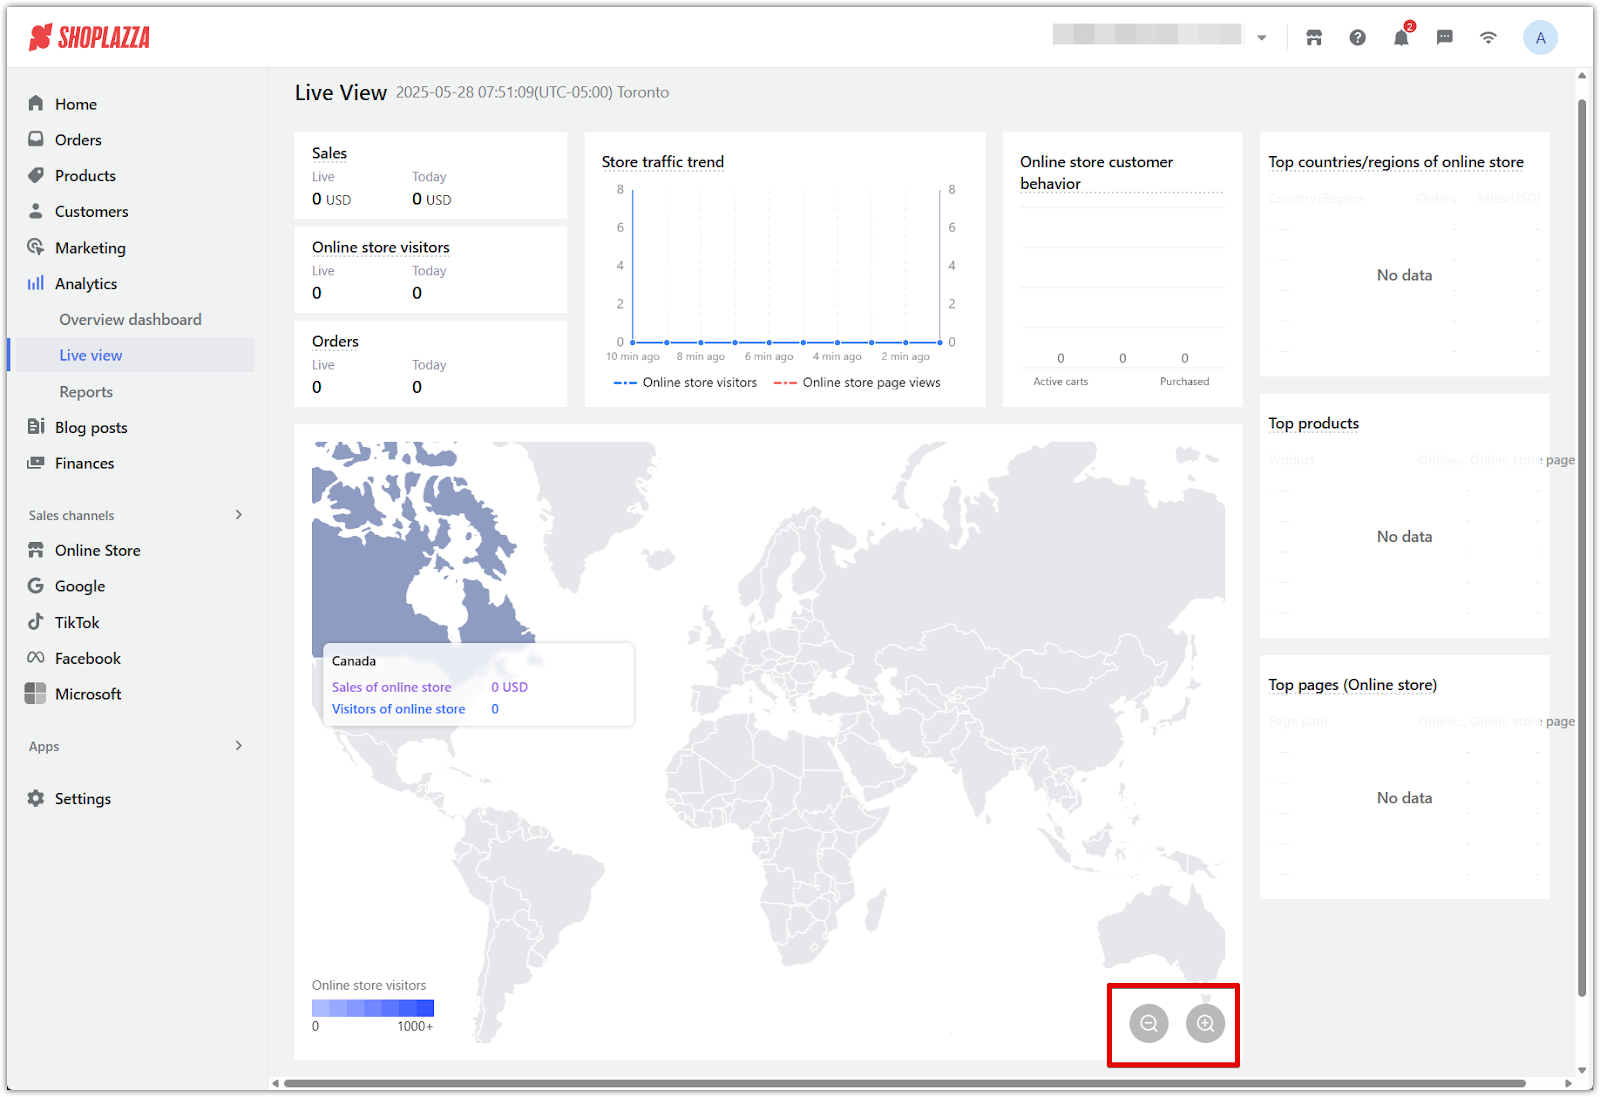
The Live View dashboard in your Shoplazza admin provides real-time insights into store visits, customer behavior, and transactions, with data refreshed every 10 seconds for immediate visibility. Whether you're monitoring campaign traffic, tracking trending products, or reviewing live sales across regions, Live View equips you with the real-time visibility needed to make quick, informed decisions and react instantly to customer activity.
Viewing real-time data
1. Go to your Shoplazza admin > Analytics > Live View to access the real-time dashboard.

2. Explore live activity: Use the interactive map to view traffic by region. Drag the map or use the + and - buttons to zoom in and analyze specific countries or areas. This helps you see where your visitors are coming from and which regions are driving sales in real time.

Note
All metrics refresh every 10 seconds. The timestamp of the most recent update appears beside the Live View title at the top of the page.
Live View Dashboard Metrics
Review each Live View metric card to understand your store’s real-time performance and the source of each data point, so you can take informed action with confidence.
| Card | Metric | Definition | Includes / Excludes |
| Sales | Live | Total value of successful orders placed in the last 10 minutes. | Includes all online sales channels and COD orders. Excludes gift card orders. |
| Today | Total value of successful orders placed since midnight. | Includes all online sales channels and COD orders. Excludes gift card orders. | |
| Online store visitors | Live | Number of unique visitors currently browsing the online store. | Includes only traffic from the online store sales channel. |
| Today | Total number of unique visitors since midnight. | Includes only traffic from the online store sales channel. | |
| Orders | Live | Number of successful orders placed in the last 10 minutes. | Includes all online sales channels and COD. Excludes gift card orders. |
| Today | Total number of orders placed today. | Includes all online sales channels and COD. Excludes gift card orders. | |
| Store traffic trend | Visitors | Number of unique users who visited the store in the last 10 minutes. | Includes only data from the online store sales channel. |
| Page views | Total number of store visits in the last 10 minutes, including repeated visits. | Includes only data from the online store sales channel. | |
| Online store customer behavior | Active carts | Number of unique users who added items to their cart in the last 10 minutes. | Includes only online store traffic. |
| Checkout activity | Number of unique users who reached the checkout page in the last 10 minutes. | Includes only online store traffic. | |
| Purchased | Number of completed orders in the last 10 minutes. | Includes only online store traffic. | |
| Top countries/regions | Orders | Number of orders placed in the last 10 minutes by country (IP-based). | Includes only data from the online store sales channel. |
| Sales | Transaction value of orders placed in the last 10 minutes by country (IP-based). | Includes only data from the online store sales channel. | |
| Top products | Visitors | Unique users who visited each product detail page. | Includes all online sales channels and COD. Excludes gift card orders. |
| Page views | Total number of product page views, including repeated visits. | Includes all online sales channels and COD. Excludes gift card orders. | |
| Top pages (Online store) | Visitors | Unique users who visited each page. | Includes only traffic from the online store sales channel. |
| Page views | Total number of page views for each page. | Includes only traffic from the online store sales channel. | |
| World Map | Sales | Total value of orders placed in the last 10 minutes by IP location (country). | Includes only sales data from the online store channel. |
| Visitors | Number of unique visitors in the last 10 minutes by IP location. | Includes only visitor data from the online store channel. |
Visit your Live View dashboard to monitor real-time activity and make data-driven decisions that boost conversions and enhance customer engagement. Use the Live View dashboard to track the impact of promotional campaigns, optimize for high-interest regions, and stay responsive to real-time sales opportunities.


Comments
Please sign in to leave a comment.