
The Overview dashboard in your Shoplazza admin provides a real‑time summary of your store’s key performance data. It helps you track traffic, sales, customer behavior, and product performance at a glance—enabling fast, informed decisions.
Accessing the overview dashboard
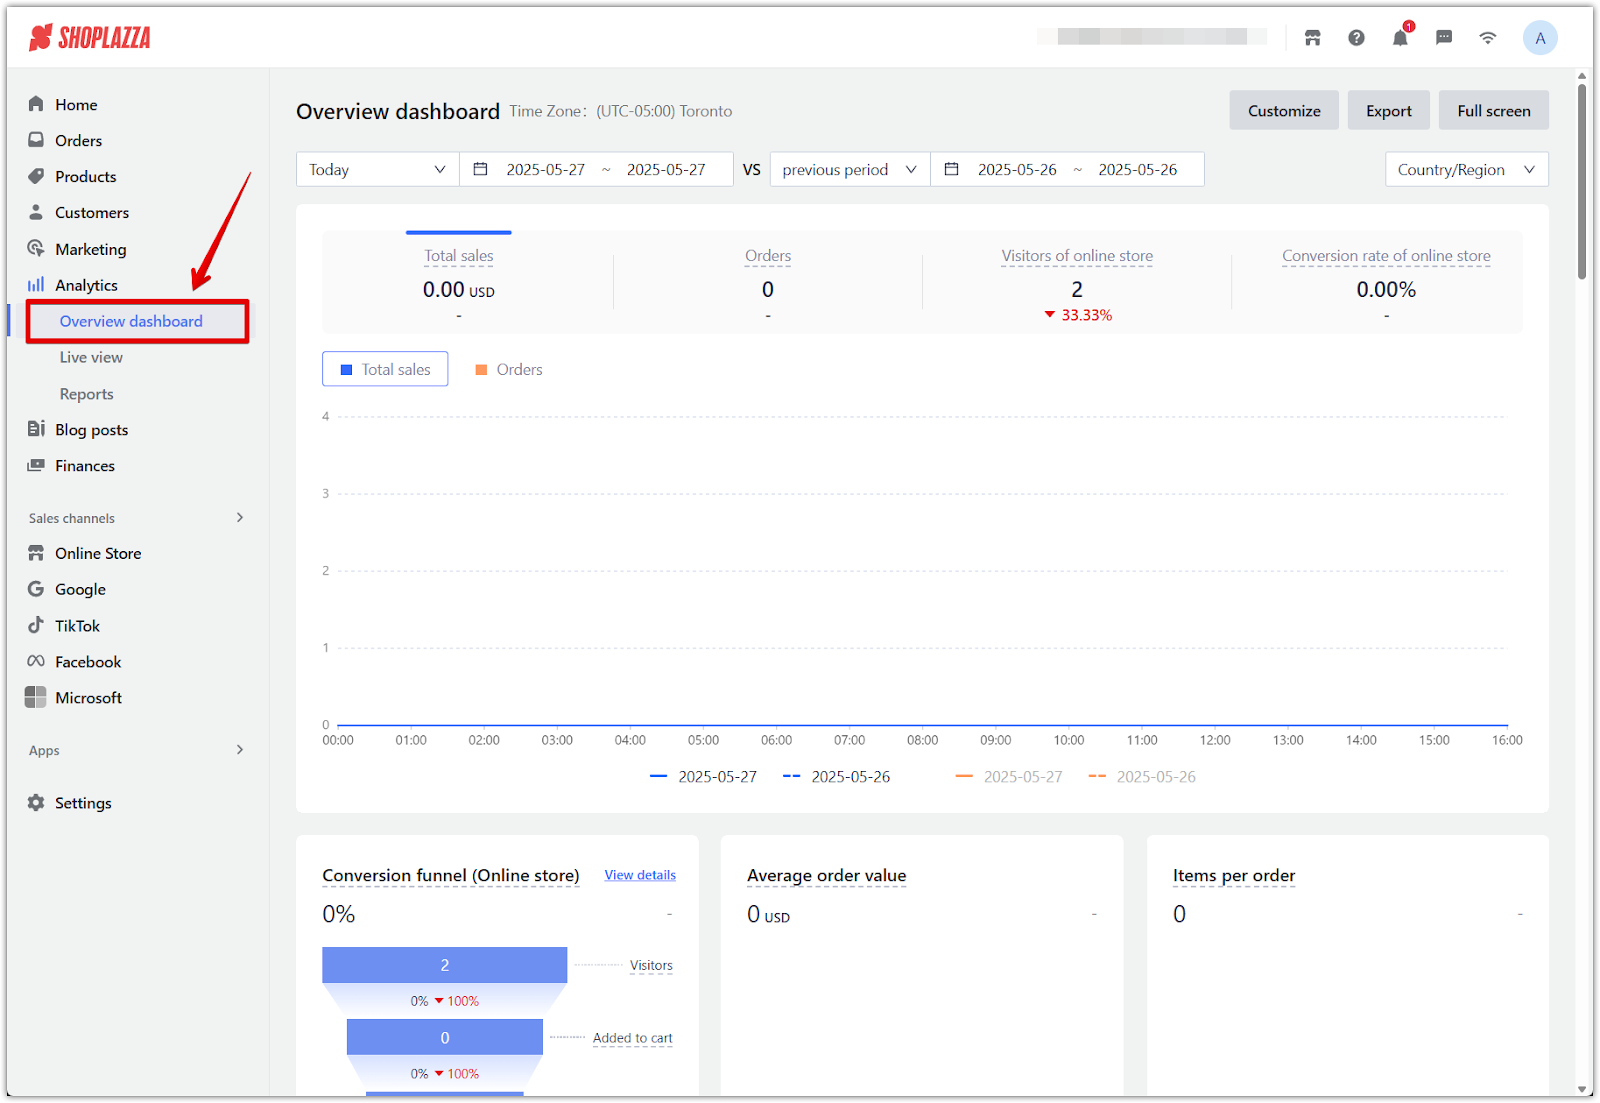
1. Go to your Shoplazza admin > Analytics > Overview dashboard to view a live snapshot of your store’s key metrics.
Dashboard controls and filters
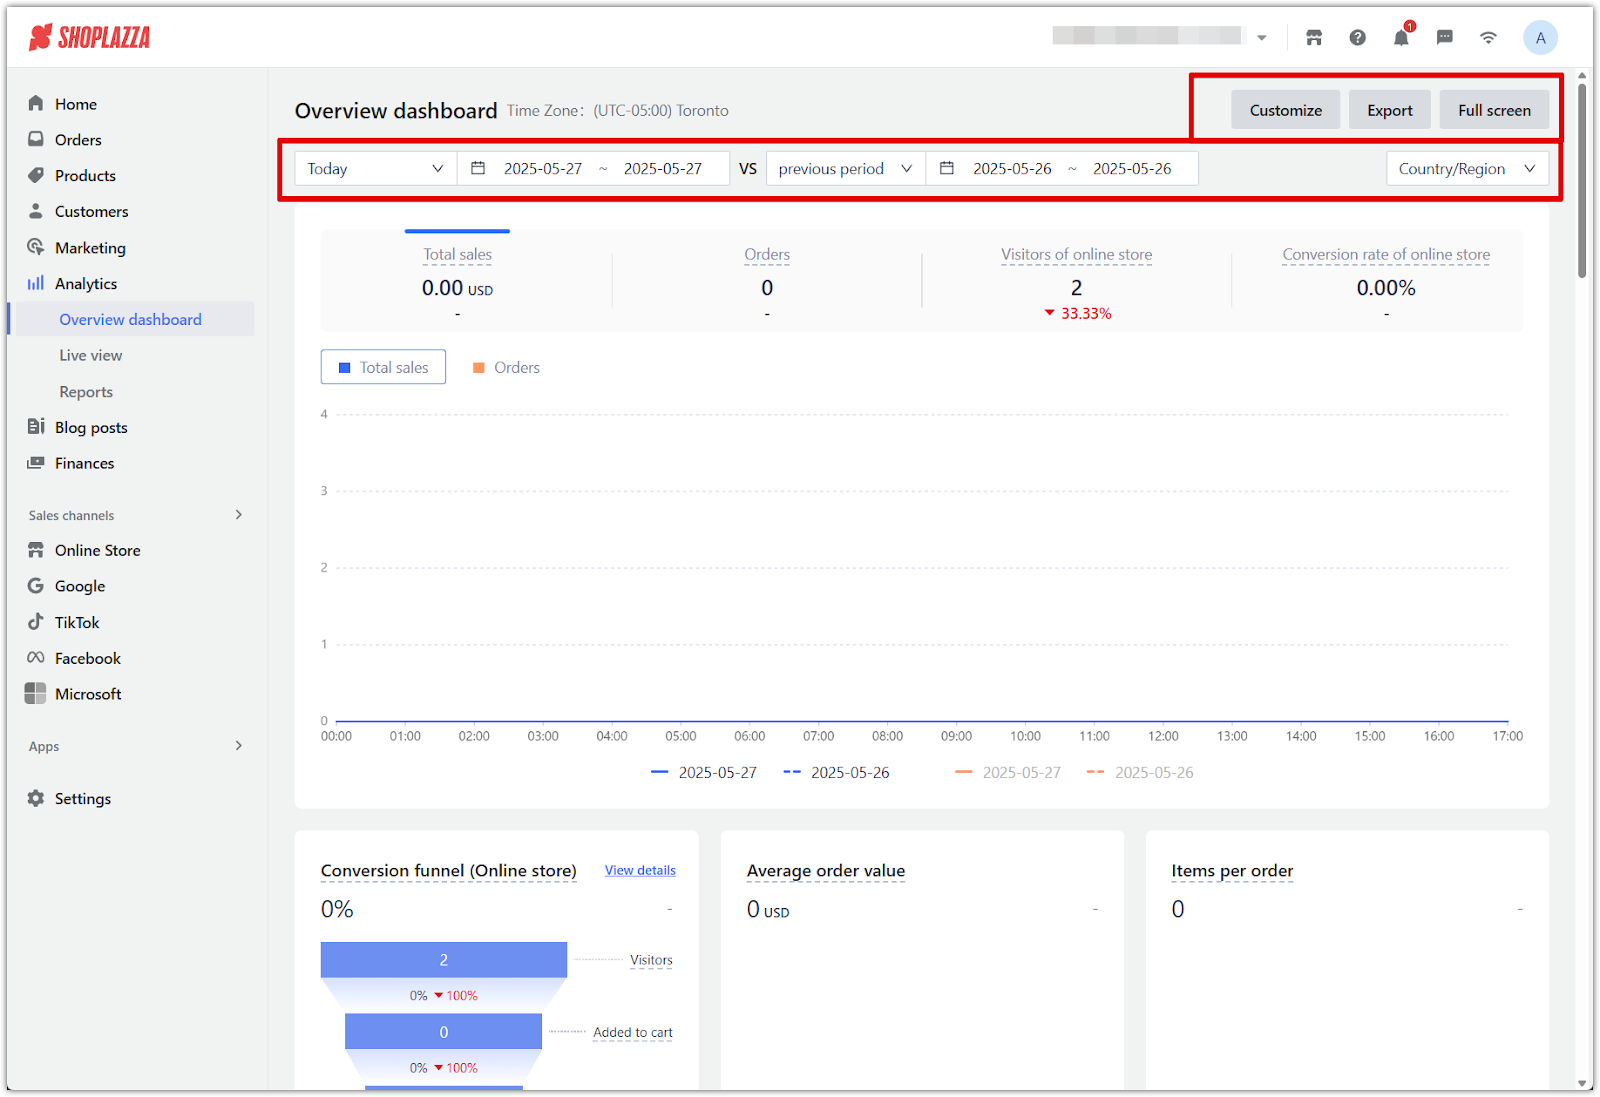
- Dashboard controls include: Use the top panel of the dashboard to refine the displayed data, manage layout preferences, and export reports for sharing or analysis.
- Date and comparison filters: Select a specific time period and compare it with a previous range to evaluate trends and changes in store performance.
- Country/region filter: Narrow your data view by selecting specific geographic markets to analyze region-based traffic or sales.
- Customize: Rearrange or hide data cards to focus on the most relevant information for your daily operations.
- Export: Download the full dashboard as a report file for internal use or presentations.
- Full screen: Expand the dashboard display for easier review during meetings or when working on large screens.
- Time settings and comparison features
- The default display shows Today’s data, from 00:00 to the current time, based on your store's timezone.
- Use the date picker to select preset ranges (like Last 7 Days) or choose Custom to set specific dates using the calendar.
- If the selected range is 3 days or less, charts display hourly data. When the range is longer than 3 days, data is grouped by day.
- Metrics are automatically compared with the previous period (e.g., today vs. yesterday, or last 7 days vs. the prior 7 days).
- When “Today” is included, the system compares hour-by-hour up to the current time (e.g., today 00:00–15:30 vs. yesterday 00:00–15:30).
- Dashed lines indicate comparison data in charts, and most cards display the percentage change next to each metric.
Overview Dashboard Metrics
The overview dashboard contains a wide range of performance metrics that help you track sales, customer behavior, traffic sources, and product engagement. To get a more in-depth analysis, click View details.
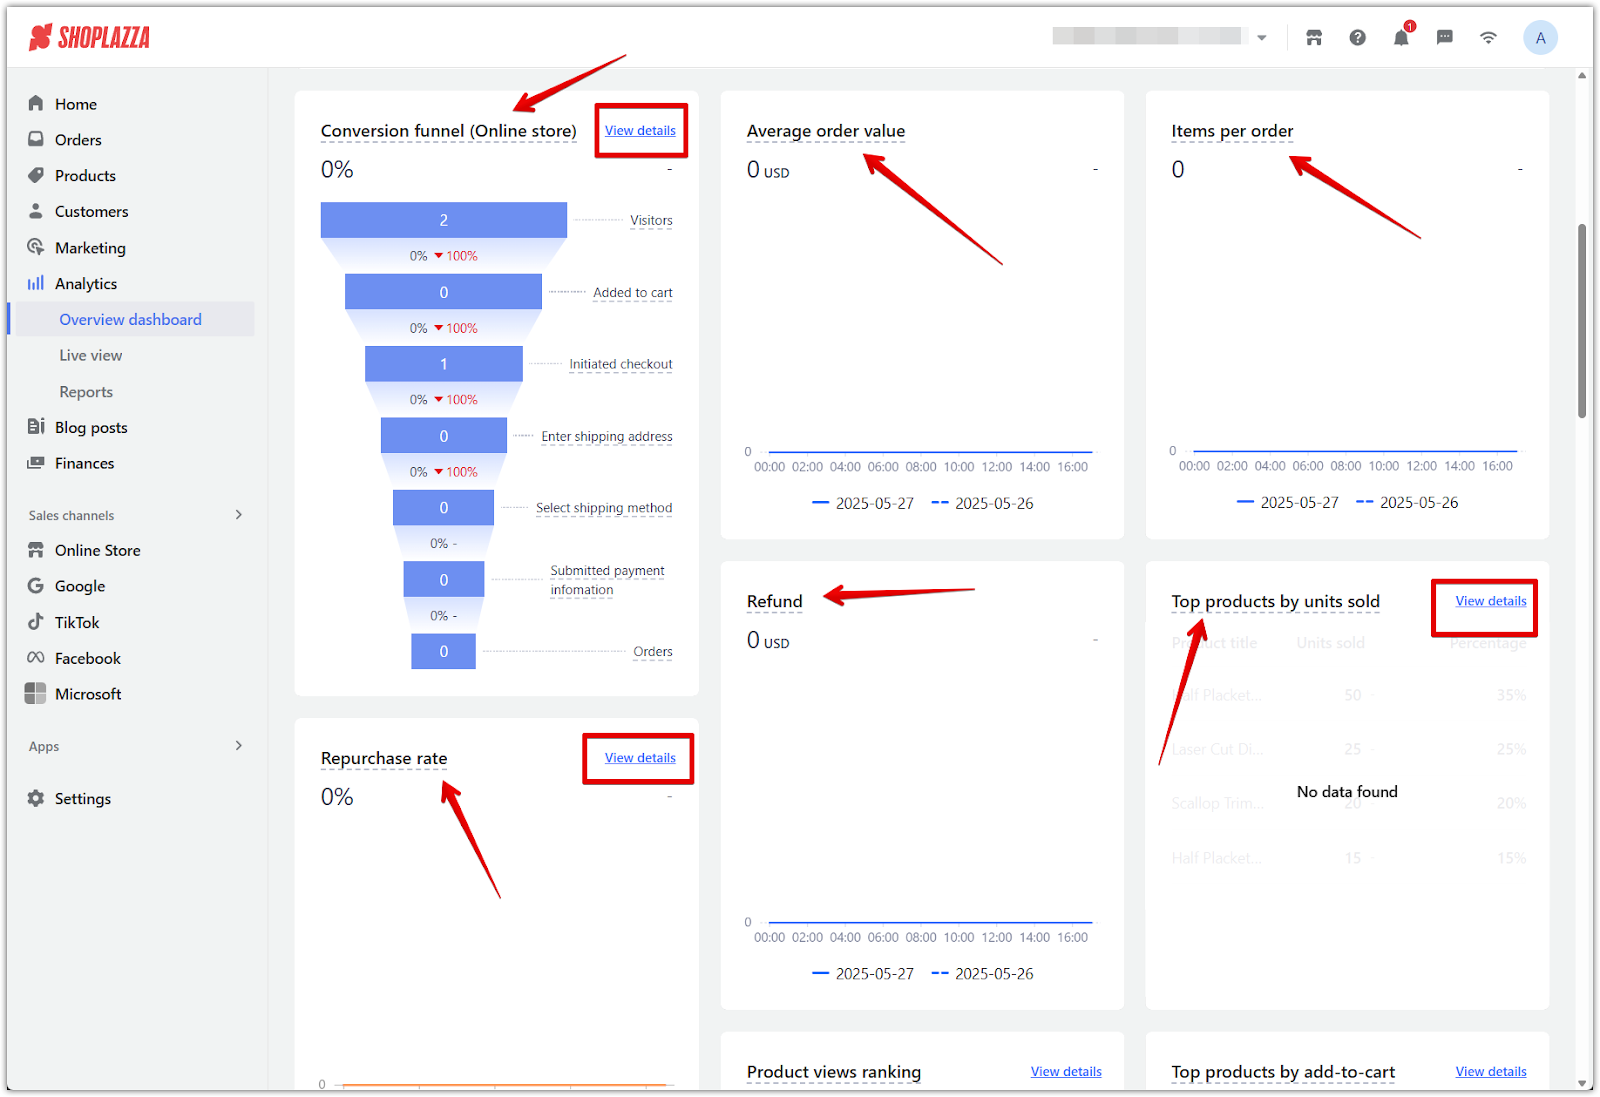
The table below outlines each dashboard card and what it tells you about your store's activity.
| Dashboard Card | Definition |
| Conversion funnel (Online store) | Only includes data where the sales channel is "online store". |
| Average order value | Total sales divided by total orders. Includes orders from all online channels. Includes COD orders. Excludes orders for sales gift cards. |
| Items per order | Total sold units divided by total orders. Gift card orders are excluded. |
| Refund | Total refunded amount based on refund orders. Includes all online channels, COD orders, and excludes gift cards. |
| Top products by units sold | Ranks products by total items sold during the selected period. Includes orders from all online channels and COD. Excludes gift cards. |
| Repurchase rate | Percentage of users who made more than one purchase out of all users who placed an order. Includes all online channels and COD. Excludes gift cards. |
| Top countries by online orders | Ranks countries or regions by order volume based on delivery address. Only includes sales from the online store channel. |
| Product views ranking | Ranks products based on views during the selected period. Only includes data from the online store channel. |
| Top products by add-to-cart | Ranks products based on the number of times they were added to cart. Only includes data from online store sales. |
| Repurchase orders | Total number of orders placed by customers with more than one purchase. Includes COD and all online channels. Excludes gift cards. |
| Average price of repurchase orders | Average order value for repeat purchases. Includes COD and all online channels. Excludes gift cards. |
| Repurchase sales | Total value of repurchase orders. Includes COD and all online channels. Excludes gift cards. |
| Order volume (by payment method) | Ranks payment methods by order count during the selected time. Includes COD and all online channels. Excludes gift cards. |
| Online store orders (by traffic channel) | Number of orders attributed to traffic sources. Only includes data from the online store sales channel. |
| Order volume of online store (by country/region) | Share of order volume by country. Only includes online store orders. |
| Online store visitors by traffic channel | Number of store visitors segmented by traffic source. Only includes online store data. |
| Orders of online store (by transaction device) | Number of orders segmented by device used to place them. Only includes online store orders. |
| Visitors of online store (by country/region) | Unique visitor count by country or region. Only includes online store data. |
| Visitors of online store (by device used) | Percentage of unique visitors per device type based on total visits. Only includes online store data. |
| Bounce rate of online store | Bounce rate of the top six most visited pages. Only includes online store data. |
| Top search keywords | Only includes data where the sales channel is "online store". |
| Top landing pages by views | Only includes data where the sales channel is "online store". |
Note
- When the selected time range is ≤ 3 days, charts display data by hour. When it exceeds 3 days, data is grouped by day.
- The default date range is set to "Today" (from 0:00 to current time). Comparison periods automatically align but can be customized.
- For the most accurate comparison, keep both the current and comparison periods the same length.
- Exported reports include: Finance summary, Visitors converted, Top search terms, Top-selling products, Visitors by location, and Top landing pages.
- Some dashboard cards may link to detailed views via a See Details button in the top-right corner.
- Data involving gift card orders is excluded from most sales, refund, and product modules.
- Metrics include cash-on-delivery (COD) orders, unless otherwise specified.
- Multi-day users are calculated based on the total number of daily active users.
Familiarize yourself with the Overview dashboard to stay on top of store performance. Use it daily to monitor trends, identify opportunities, and take timely action based on real-time insights.


Comments
Please sign in to leave a comment.