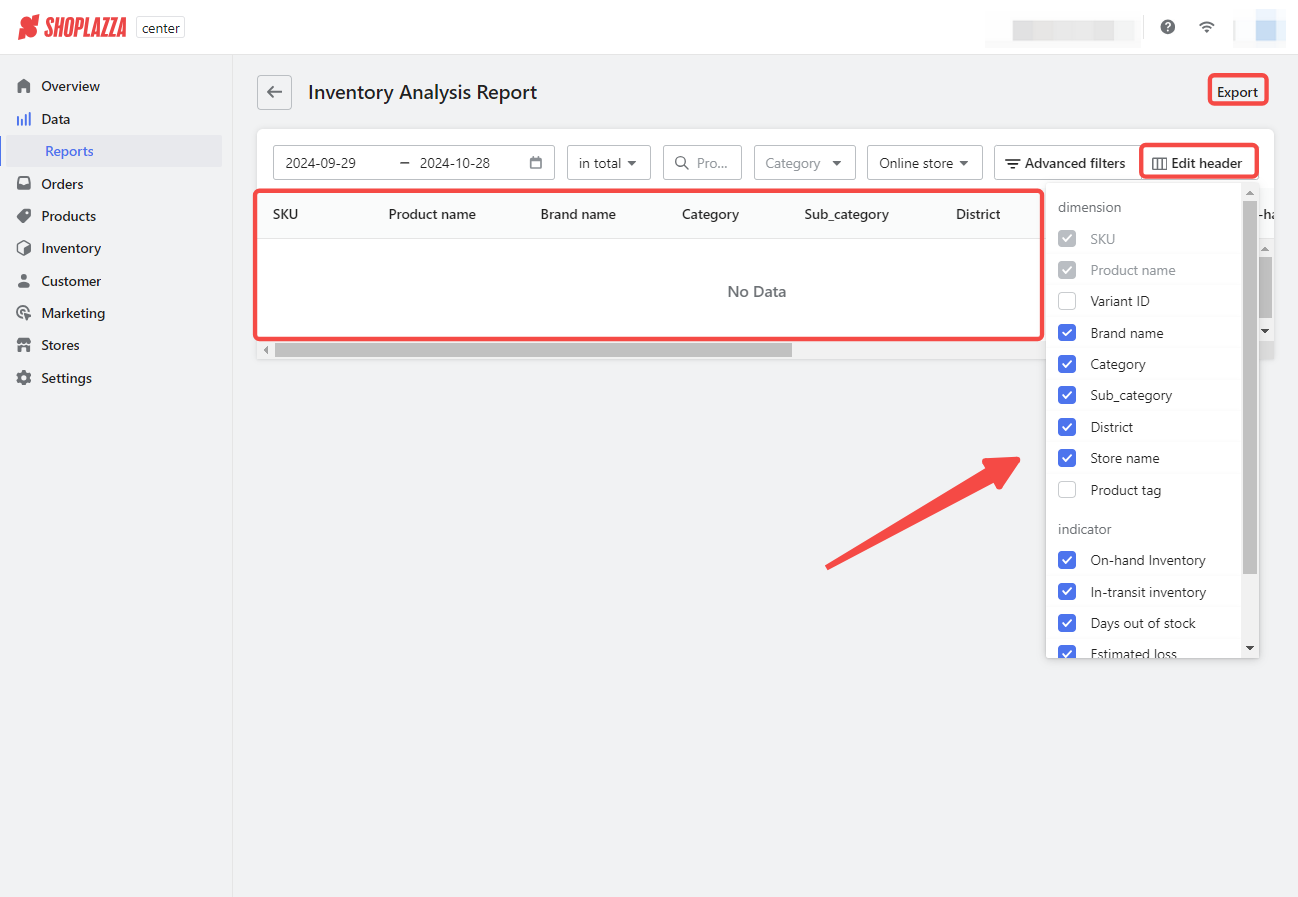
The Inventory Analysis Report offers a detailed overview of your inventory levels, product distribution, and stock management, helping to optimize turnover and reduce excess stock. This report can be customized to display only the most relevant metrics for your analysis, and filters enable focusing on specific time periods, products, and brands.
Note
By clicking the Edit header button, the report's metrics can be tailored to suit your business needs. Export the data for further review and analysis offline.


Inventory analysis report metrics
The Inventory Analysis Report provides a comprehensive view of your inventory situation. It helps understand inventory levels, manage product distribution, and optimize stock management. The report contains several key metrics:
Inventory period and product details:
- SKU: A unique identifier assigned to each product makes tracking and managing individual items in your inventory easier.
- Product name: The name of the product, used to identify specific items in the report.
- Variant ID: The identifier for different versions of a product, such as color or size variations.
- Brand name: The name of the brand under which the product is sold, useful for evaluating brand-specific performance.
- Category: The broad classification the product falls under helps group products by type.
- Sub_category: A more specific category that provides further details about the product’s classification.
- District: The regional location associated with the product, helping track stock across different geographic areas.
- Store name: The specific store where the product is located or sold, offering insights into store-specific inventory levels.
- Product tag: Keywords or labels associated with the product, useful for filtering and searching specific items.
Stock levels and availability:
- On-hand inventory: The number of units currently available in stock, providing real-time insight into inventory levels.
- In-transit inventory: The number of units currently on order but have not yet arrived indicates future stock availability.
- Days out of stock: The number of days a product has yet to be available for sale can highlight potential missed sales opportunities.
Business impact and inventory performance:
- Estimated loss: The potential revenue lost due to products being out of stock, helping to quantify the financial impact of stockouts.
- Slow-moving days: The number of days a product has been in stock but not sold, highlighting potential overstock issues or slow-moving products.
These metrics provide a comprehensive view of inventory performance, helping you make informed decisions regarding stock levels, restocking, and optimizing inventory turnover. Regularly reviewing this report allows for better stock management and ensures that business resources are kept in excess inventory.


Comments
Please sign in to leave a comment.