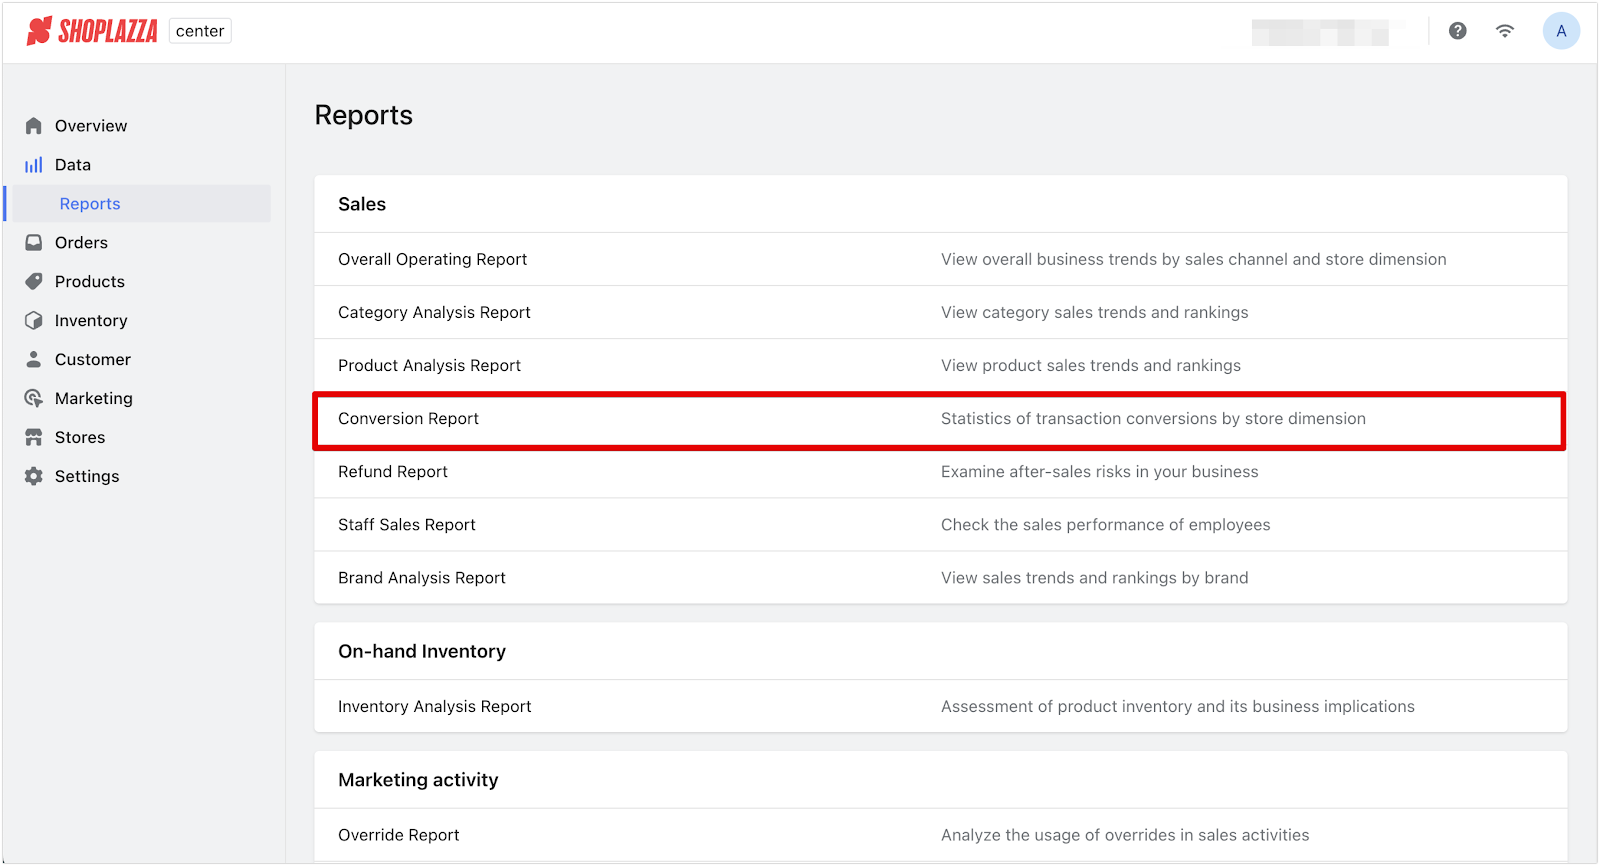
Measure your stores’ effectiveness in turning visitors into buyers. This metric is key for assessing the impact of sales strategies and optimizing customer engagement.
Note
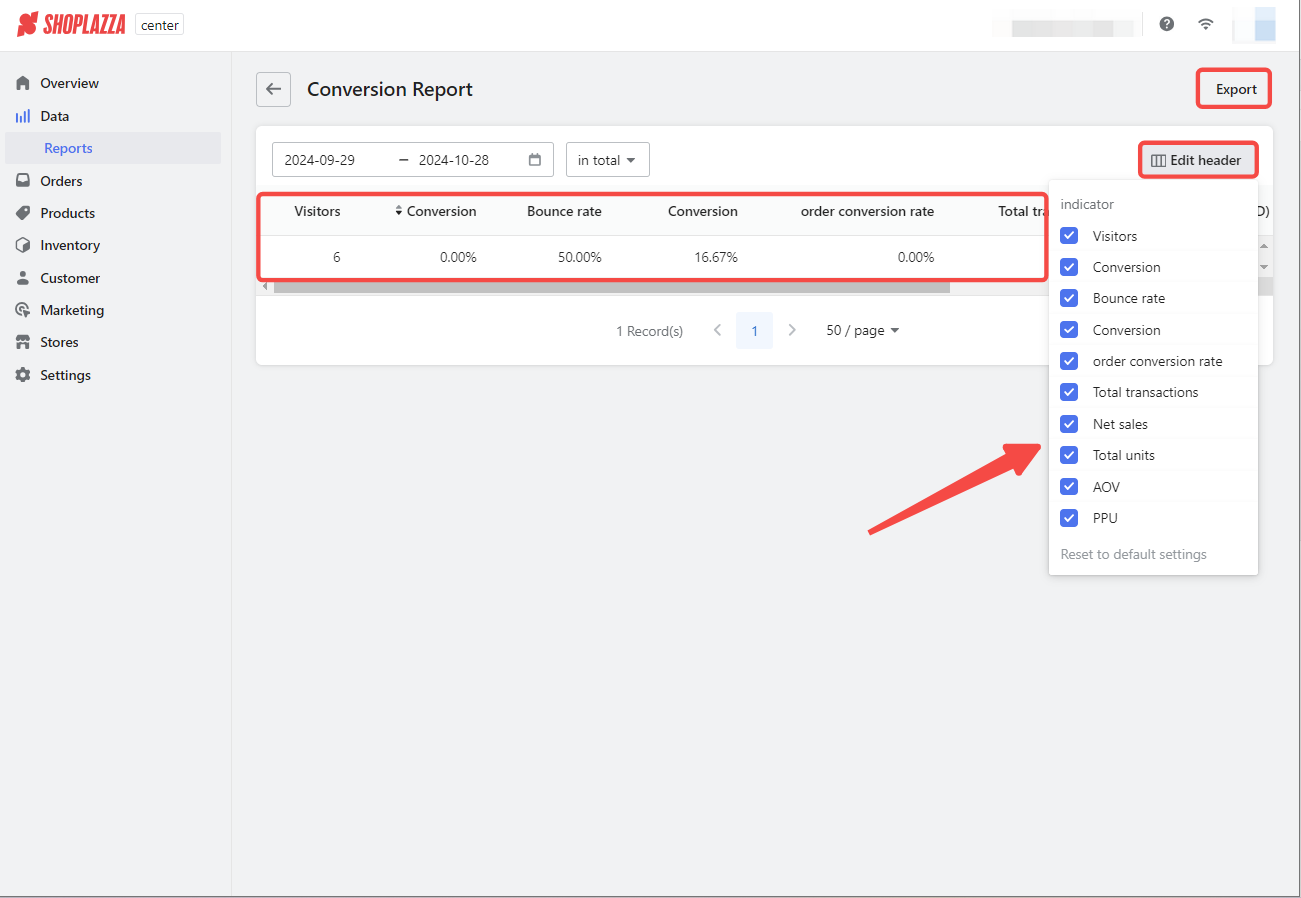
Customize the metrics shown in your report by clicking the Edit header button. This allows you to activate, deactivate, and reorder different metrics based on your preferences. Filter by date and store, edit report headers for personalized views, and export data for offline analysis.


Conversion report metrics
The Conversion Report provides valuable insights into your store’s performance. Below are the key metrics included in the report:
Traffic and engagement metrics:
- Visitors: The total number of unique visitors who entered your store. This metric helps you understand the overall foot traffic, giving a broad sense of how many people are engaging with your store.
- Bounce rate: The percentage of visitors who leave without making a purchase. A high bounce rate can indicate issues with customer engagement or product offerings and helps identify areas for improvement to keep visitors interested.
Conversion metrics:
- Conversion: The percentage of visitors who complete a purchase. This metric is important for determining how effectively your store is turning visitors into paying customers. It reflects the success of your product placement, customer service, and overall shopping experience.
- Order conversion rate: The percentage of total visitors who place an order. This provides a more detailed view of your store's success in closing sales, allowing you to analyze and improve your conversion tactics.
Sales transactions and volume:
- Total transactions: The total number of completed sales transactions in your store. This metric offers insight into overall store activity and sales volume, helping to identify peak sales periods and trends over time.
- Total units: The total number of individual products sold. This directly reflects product demand and can help track inventory needs and identify best-selling items.
Financial performance metrics:
- Net sales: The total revenue generated from sales after accounting for refunds, taxes, discounts, and shipping fees. This provides a clear picture of your store's revenue and is key to assessing financial performance.
- AOV (Average Order Value): The average amount spent per transaction. A higher AOV indicates that customers are purchasing more items or more expensive products per transaction, which can help identify the effectiveness of upselling strategies.
- PPU (Price per Unit): The average price at which each product was sold. This metric helps you evaluate your pricing strategy and determine whether your products are being sold at their intended value or if adjustments are needed.
Use this report to refine your sales approach and customer engagement, ensuring visitors are more likely to become paying customers.


Comments
Please sign in to leave a comment.