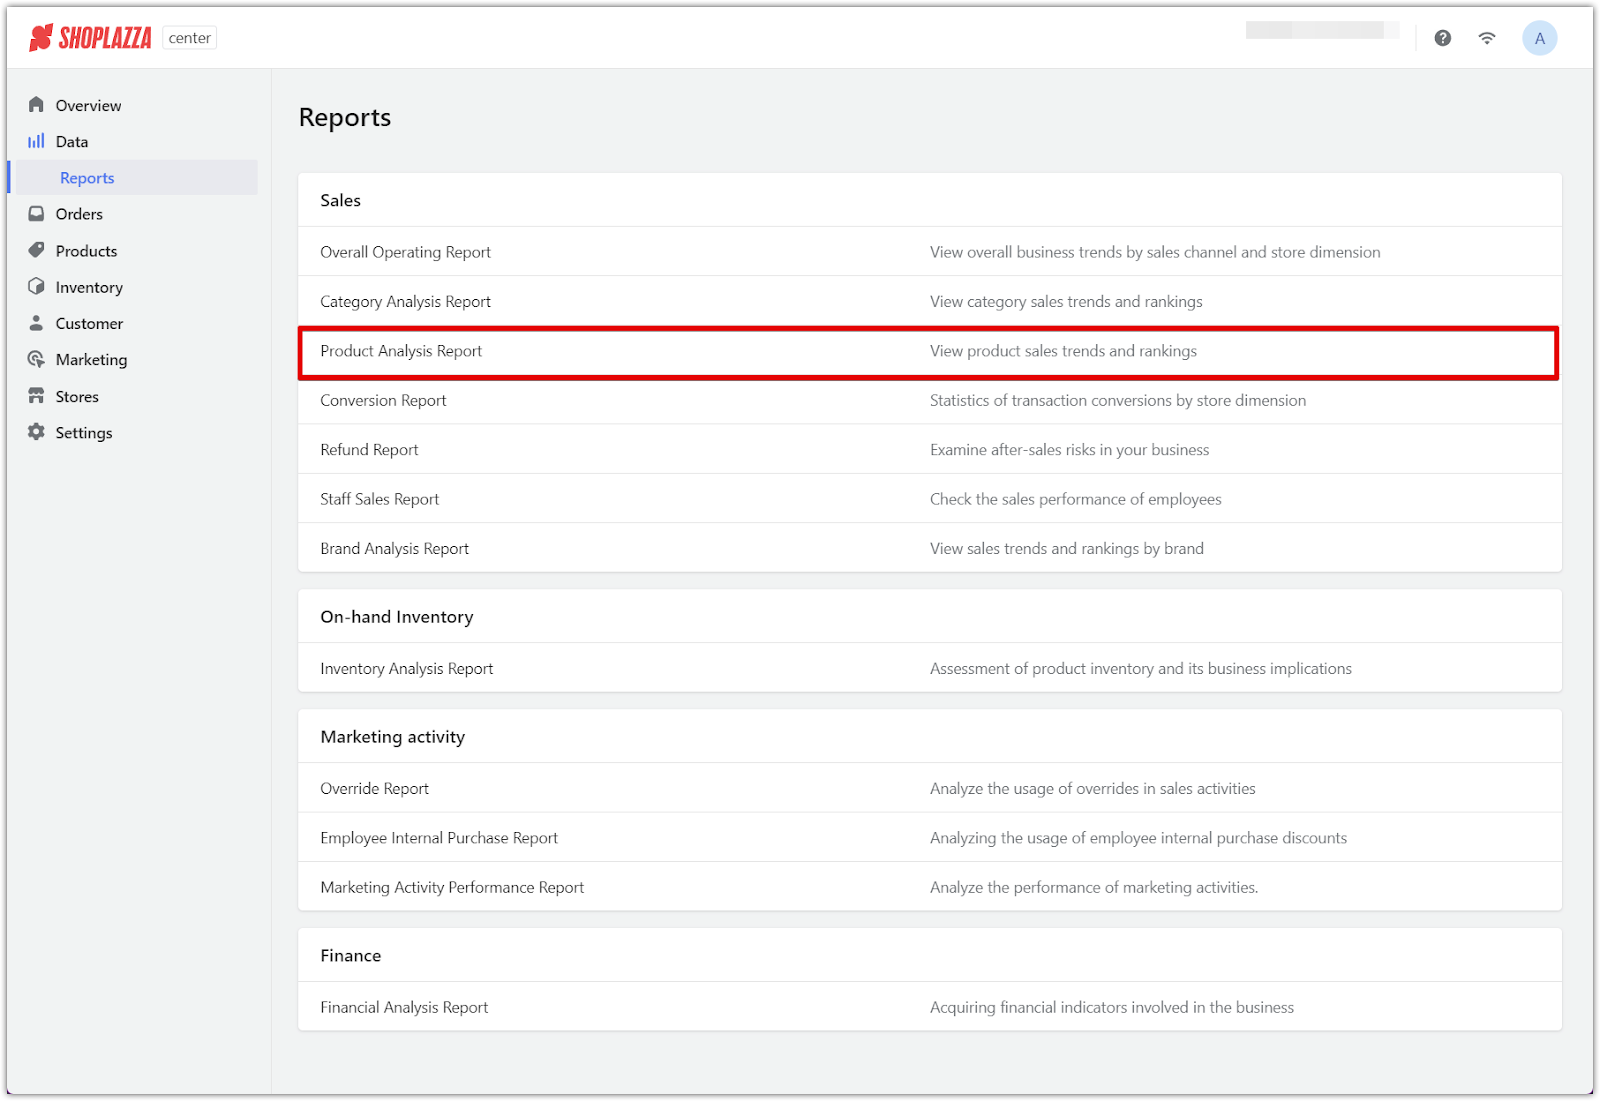
Analyze product sales trends and rankings to pinpoint top-performing products and areas for improvement. This report is invaluable for inventory planning and marketing strategies.
Note
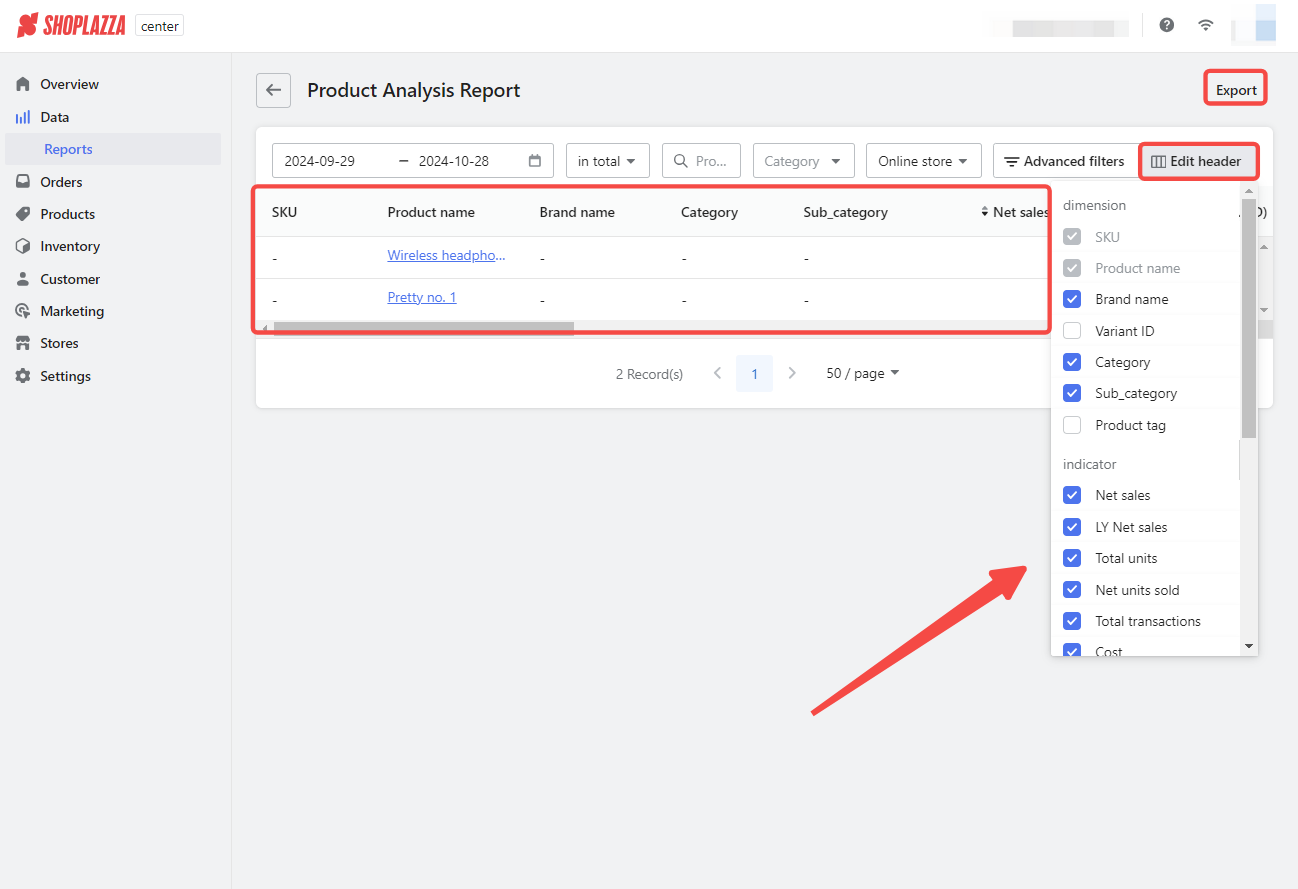
Filter the data by date and store, customize report headers for personalized views, and export the data for offline analysis. Additionally, the metrics displayed in this report can be adjusted by clicking the Edit header button, allowing you to tailor the report to your needs. You can use the Advanced filters option to focus on specific brands for more refined data.


Product analysis report metrics
The product analysis report provides a detailed look at each product's performance, allowing you to dive deep into sales trends, inventory requirements, and customer preferences. Below is an expanded explanation of each metric:
Product identification and categorization
- SKU: The unique inventory tracking number assigned to each product. This helps manage and track stock across different locations and sales channels.
- Product name: The official name of the product as it appears in your catalog.
- Brand name: The manufacturer or trademark associated with the product, which can influence customer preferences and sales.
- Category: The primary group or segment the product belongs to, helping you understand performance within specific product lines.
- Sub-category: A more refined classification within the main category, offering deeper insights into product segmentation.
- Variant ID: A unique identifier for different versions of a product, such as size, color, or model. (Not selected in your current settings.)
- Product tag: Additional descriptors or keywords associated with the product that are useful for filtering and targeted marketing. (Not selected in your current settings.)
Sales and volume metrics
- Net sales: The total revenue from product sales after deducting taxes, shipping fees, discounts, and refunds. This metric gives a clear picture of the actual earnings from sales.
- LY Net sales: This metric shows last year’s net sales for the same period, allowing you to compare current performance against historical data.
- Total units: The total quantity of products sold, providing a snapshot of sales volume.
- Net units sold: The total number of products sold, adjusted for any refunds, offering a more accurate view of the actual sales.
Transactional insights
- Total transactions: The total number of sales transactions processed during the period. This helps gauge customer purchase behavior.
- Net transactions: The revenue left after subtracting the cost of goods sold from net sales, providing insight into profitability on a transactional basis.
Cost and profitability analysis
- Cost: The total cost of acquiring or producing the products sold is essential for understanding the cost structure and profitability.
- Gross profit: The profit remaining after deducting the cost of goods sold from net sales. This is a key measure of overall profitability.
- GPM (Gross profit margin): The percentage of sales revenue that remains as profit after accounting for the cost of goods sold, indicating overall financial health.
Efficiency and discount evaluation
- Discount: The total discount amount applied to the products sold. This helps understand the impact of discounts on sales and profit margins.
- Net AOV (Average order value): The average amount spent per sales transaction, excluding refunds, providing insight into customer spending behavior.
- PPU (Price per unit): The average price at which each product unit is sold, helping to analyze pricing strategy effectiveness.
- Net PPU: The average price per unit sold, adjusted for discounts and refunds, offering a more accurate view of actual pricing.
Customer interaction and retention metrics
- Visitors: The number of visitors to your store, whether online or in a physical location, providing insight into customer interest and foot traffic.
- Conversion: The percentage of visitors who made a purchase compared to total store traffic. This metric is crucial for understanding how well your store converts traffic into sales.
- Refunded amount: The total dollar amount of refunded sales, impacting net revenue.
- Refunded units: The total number of products customers return, helping identify potential issues with product quality or customer satisfaction.
- Refund rate: The percentage of total transactions that resulted in refunds, indicating customer satisfaction and product performance.
Remember, these metrics can be customized by clicking the Edit header button, allowing you to adjust the report according to your specific needs and focus areas. Use the Advanced filters option to refine your data by particular brands, categories, or other criteria for more targeted analysis.


Comments
Please sign in to leave a comment.