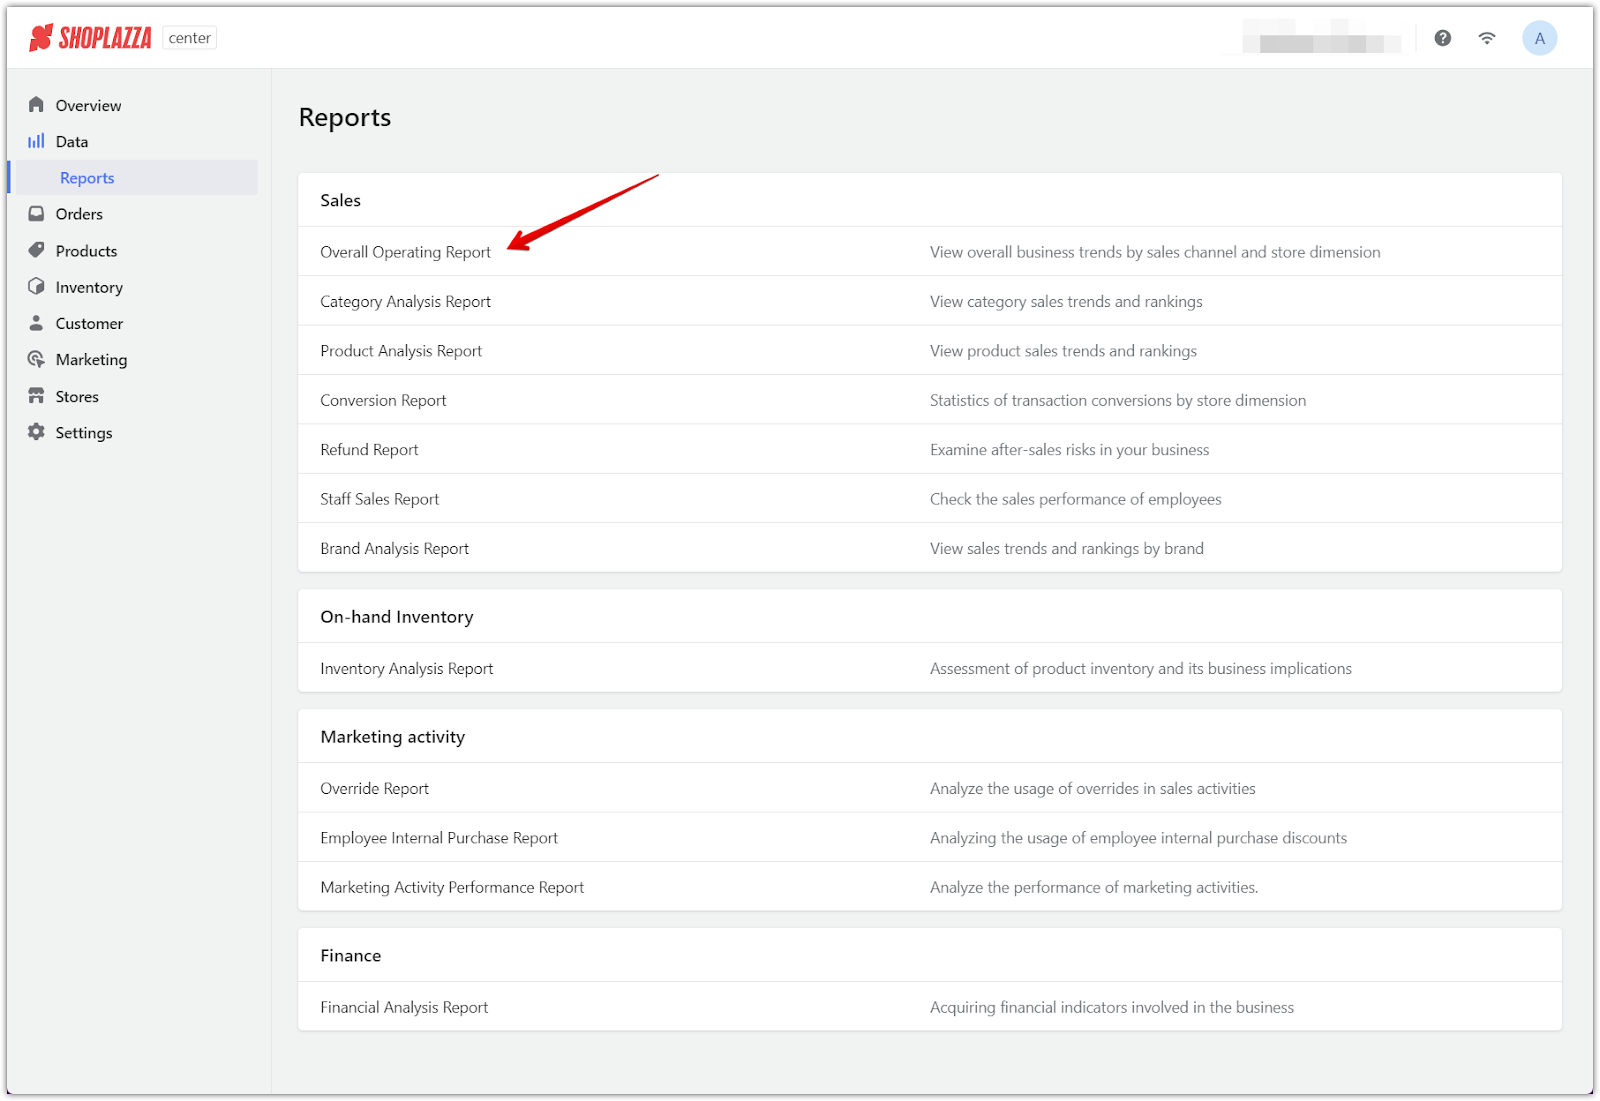
Reviewing the Overall Operating Report feature provides valuable insight into your business's performance across different sales channels and individual store metrics. You can easily access this feature within the Data > Reports section of the Center admin.
Note
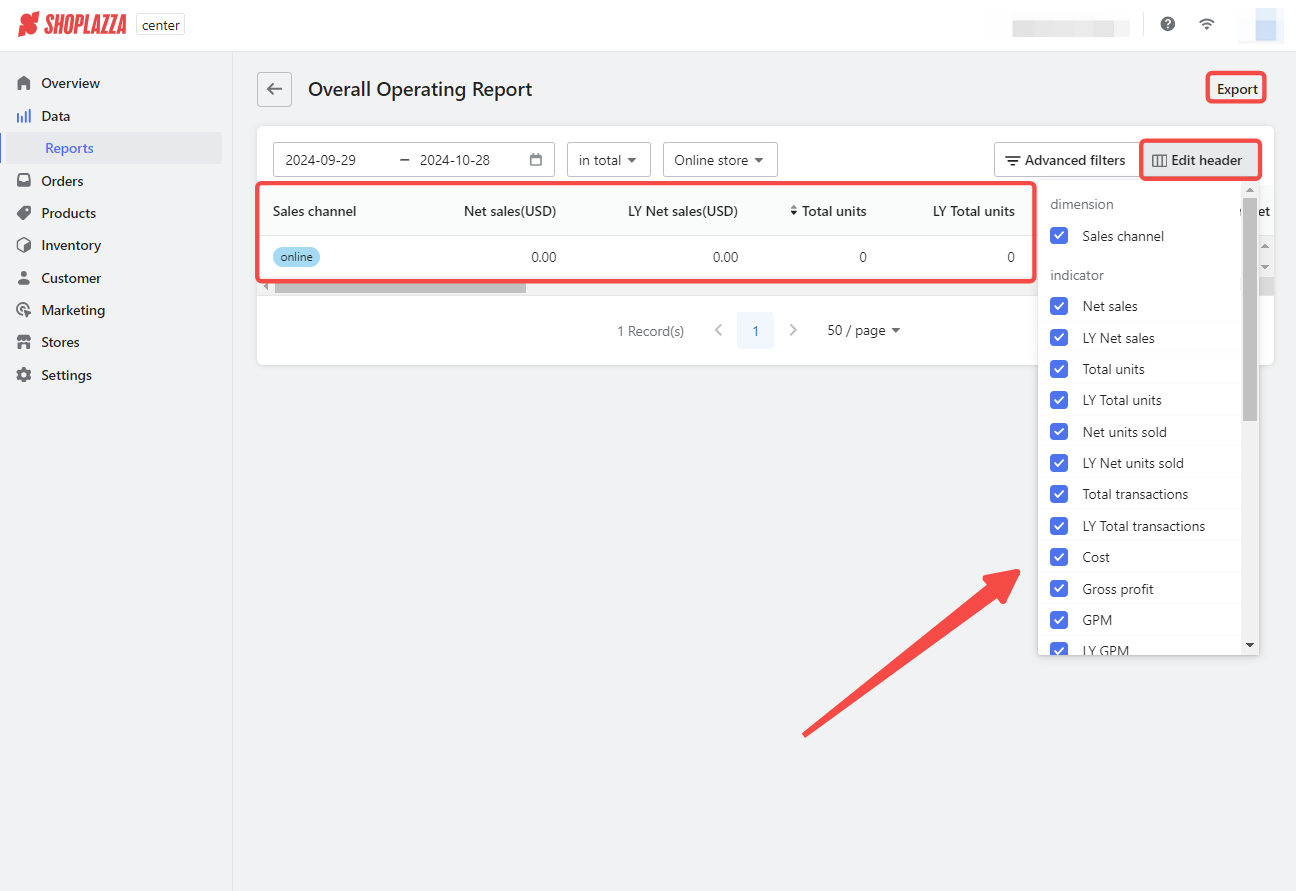
Customization and export options: Filter by date and store, edit report headers for personalized views, and export data for offline analysis.


Overall operating report metrics
These metrics help you analyze everything from sales and financial performance to customer engagement and the effectiveness of promotions, enabling you to make informed decisions and optimize your operations. Additionally, you have the flexibility to customize these metrics by clicking on the Edit header button, allowing you to add or remove metrics based on your specific needs. Below is a detailed explanation of each metric included in the report:
Sales performance metrics
- Net sales (USD): This represents the total revenue generated from sales, minus any returns, discounts, or allowances.
- LY Net sales (USD): LY stands for Last Year. This metric shows net sales from the same period last year, allowing you to compare current performance against past results.
- Total units: The total number of units sold across all channels and stores without considering any returns.
- LY Total units: The total number of units sold during the same period last year, enabling a year-over-year comparison.
- Net units sold: The number of units sold after accounting for returns, providing a clearer picture of actual sales.
- LY Net units sold: The number of net units sold during the same period last year for comparison.
- Total transactions: The total number of completed sales transactions, offering insight into the volume of sales activity.
- LY Total transactions: The total number of sales transactions recorded during the same period last year.
Financial metrics
- Cost: The total cost incurred to acquire the goods sold during the period, including production, procurement, and other associated expenses.
- Gross profit $: This metric is calculated as Net Sales minus the Cost of goods sold. It indicates the profit earned before deducting other operating expenses, taxes, and costs.
- GPM (Gross Profit Margin): Gross Profit Margin is the ratio of gross profit to net sales, expressed as a percentage. It shows how efficiently a company is producing and selling goods relative to its revenue.
- LY GPM: The gross profit margin for the same period last year, providing a basis for comparison.
- Net AOV (Average Order Value): This metric represents the average amount spent per transaction after adjusting for returns and discounts. It gives insight into the spending behavior of customers.
- LY Net AOV: The average order value for the same period last year, helping to analyze trends in customer spending.
Product pricing metrics
- PPU (Price Per Unit): The average price at which each unit is sold, without accounting for discounts or returns, reflecting the base selling price of products.
- Net PPU: The average price per unit sold after adjusting for discounts and returns, providing a more accurate picture of what customers are actually paying per unit.
Customer engagement metrics
- Visitors: The total number of people who visited the store or site, providing a sense of traffic and potential customer interest.
- Conversion: The conversion rate is the ratio of completed sales transactions to the total number of visitors. It indicates the effectiveness of sales efforts in turning visitors into buyers.
Refund and promotion metrics
- Refunded amount: The total value of refunds issued during the period, helping gauge the level of customer dissatisfaction or return activity.
- Refund: The number of units or transactions refunded, which can highlight issues with product quality or customer satisfaction.
- Refunded units: The total number of units returned and refunded, providing insight into the volume of product returns.
- Refund rate: The ratio of refunds to net sales, expressed as a percentage, indicating potential customer satisfaction or product quality issues.
- UPT (Units Per Transaction): The average number of units sold per transaction, helping to understand customer buying behavior.
- UUPT (Unique Units Per Transaction): The average number of different units (SKUs) sold per transaction, providing insight into the variety of products customers purchase together.
- Coupons: This metric shows the impact of coupon usage on sales, typically expressed as a percentage or total value. It helps analyze the effectiveness of promotional campaigns and discounts.
Advanced filters in the overall operating report
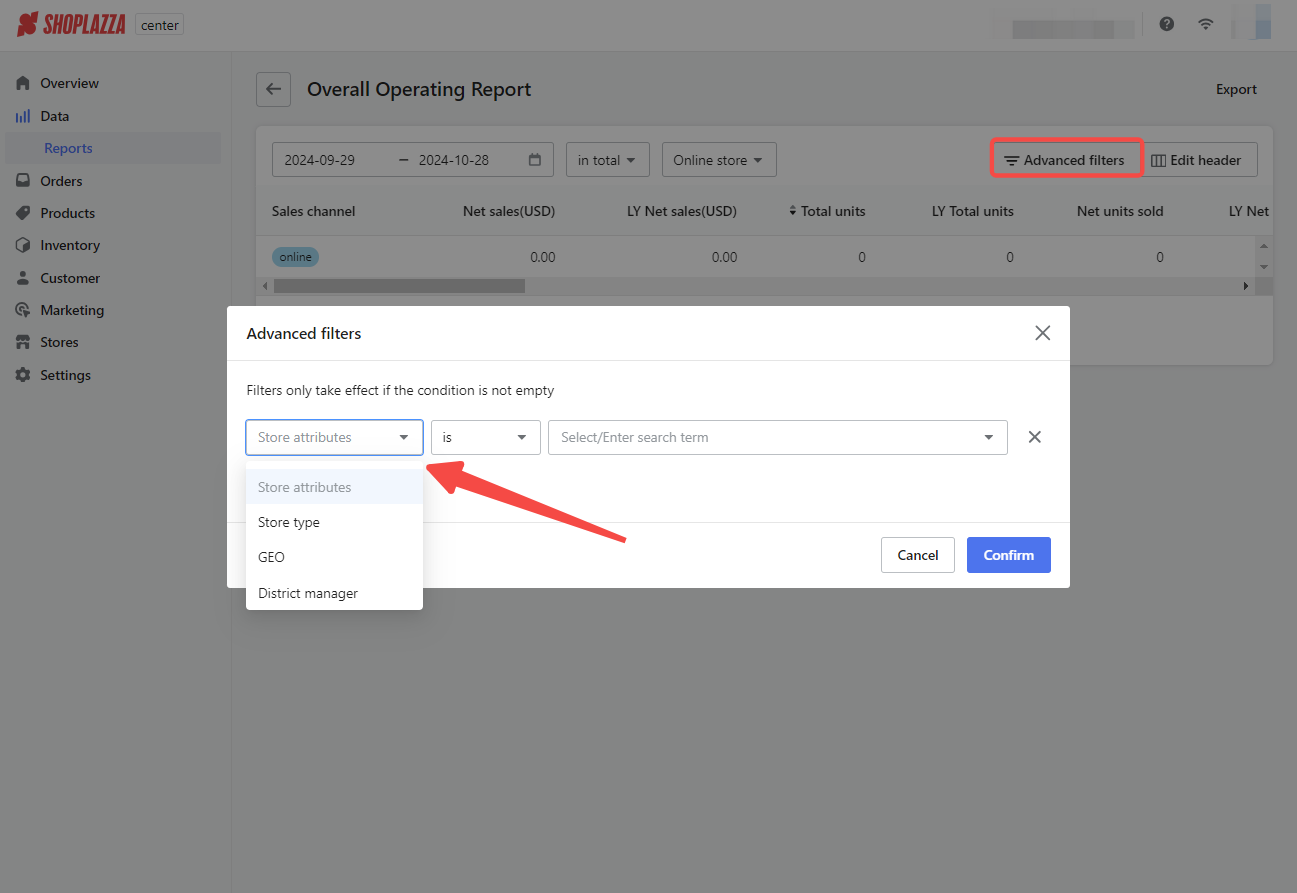
The Advanced Filters feature allows you to refine the data displayed in your Overall Operating Report, ensuring you only see the most relevant information to your analysis. You can apply multiple filter conditions to narrow the data by specific attributes.

In the filter dropdown menu, you have the following options:
- Store attributes: Filters data based on characteristics of the stores, such as location or specific identifiers.
- Store type: Allows you to filter results by the type of retail environment, such as an outlet, mall, or standalone store, giving you more focused insights based on store categorization.
- GEO (Geography): This filter lets you narrow down the data by the geographical location of the stores, helping you analyze regional performance.
- District manager: Filters data by the district manager responsible for overseeing the store operations within specific districts, enabling a more detailed view of management performance.
To use the Advanced Filters, select the desired attribute, specify the condition, and enter or select the appropriate search term. Once applied, these filters will refine the report to display only the data that matches your criteria, making it easier to focus on specific areas of interest within your business operations.
These metrics are calculated precisely to help you gain deep insights into your business operations. Use this structured data to guide strategic decision-making and optimize your operational efficiency. By leveraging this information, you can identify trends, pinpoint areas for improvement, and strategize accordingly to enhance your business outcomes.


Comments
Please sign in to leave a comment.