
The Analytics section in your Shoplazza admin offers a powerful suite of ecommerce performance tracking tools designed to help you grow your business. This article explains how to navigate the Overview dashboard, Live view, and Reports to monitor sales, understand customer behavior, and optimize marketing efforts. Get actionable insights that support smarter decisions and long-term success.
Navigating to Analytics
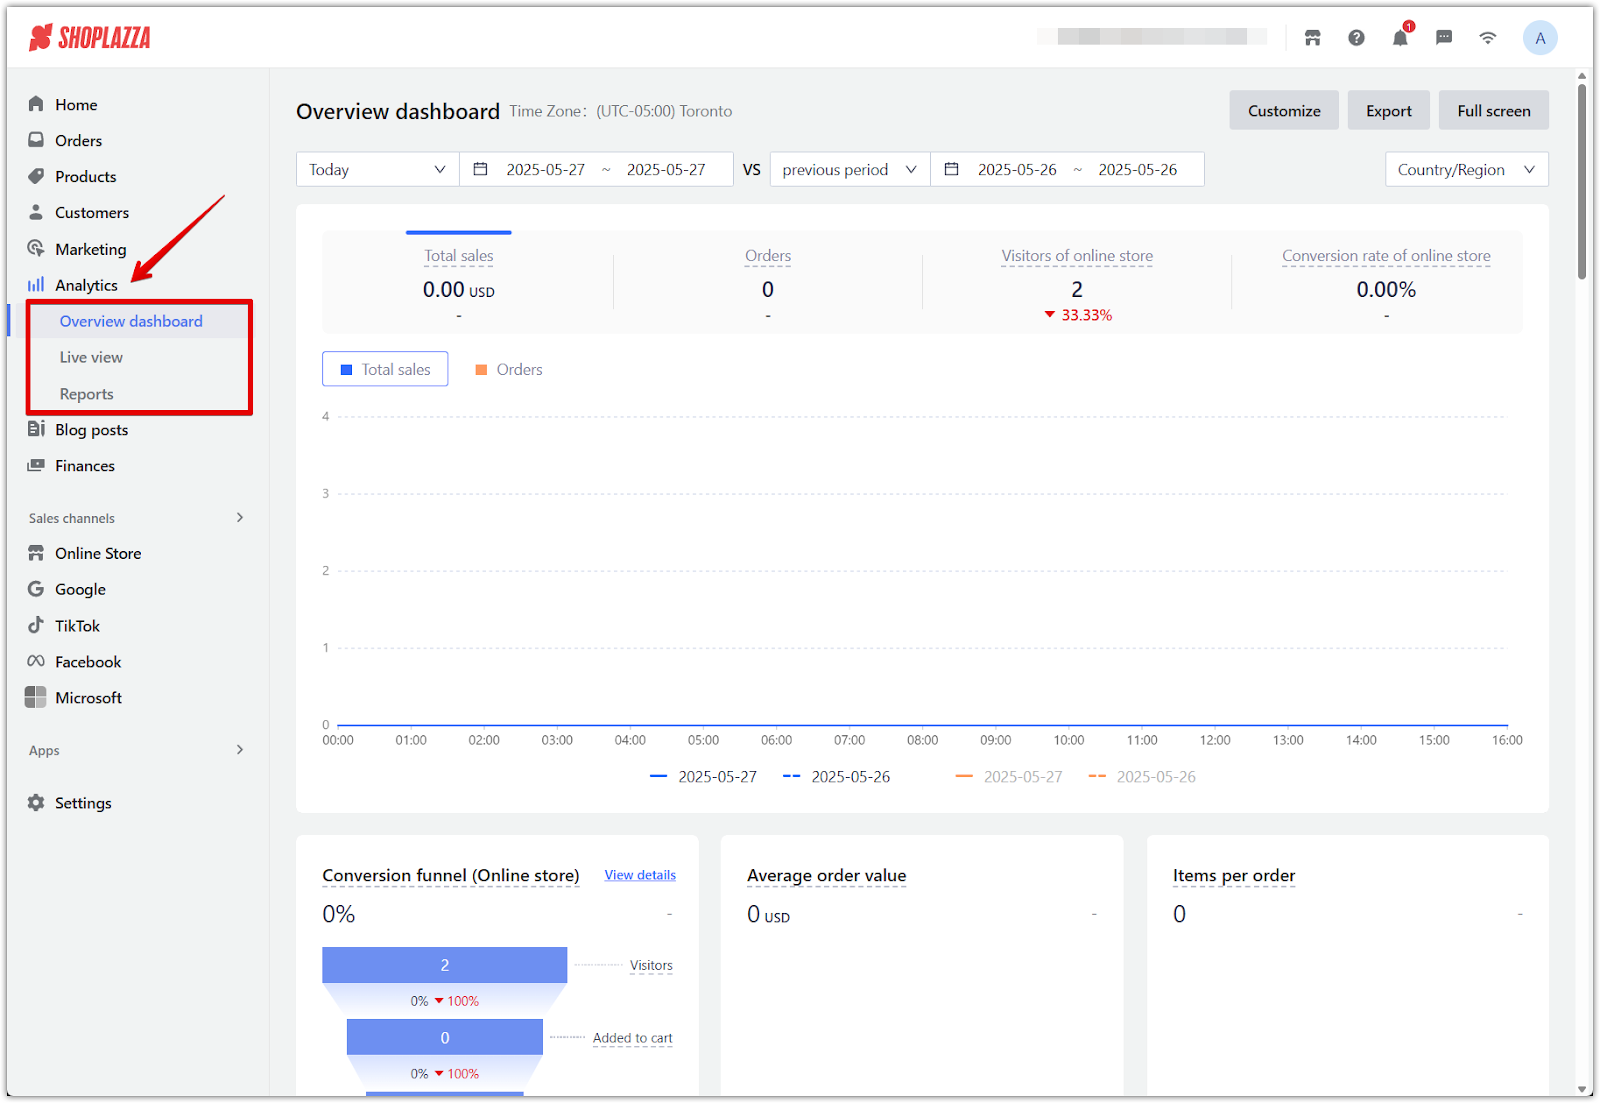
1. Open the Analytics section: Go to your Shoplazza admin > Analytics to access all performance tracking tools, including Overview dashboard, Live view, and Reports.
Overview dashboard
Gain a clear summary of your store’s key performance indicators in one centralized view.
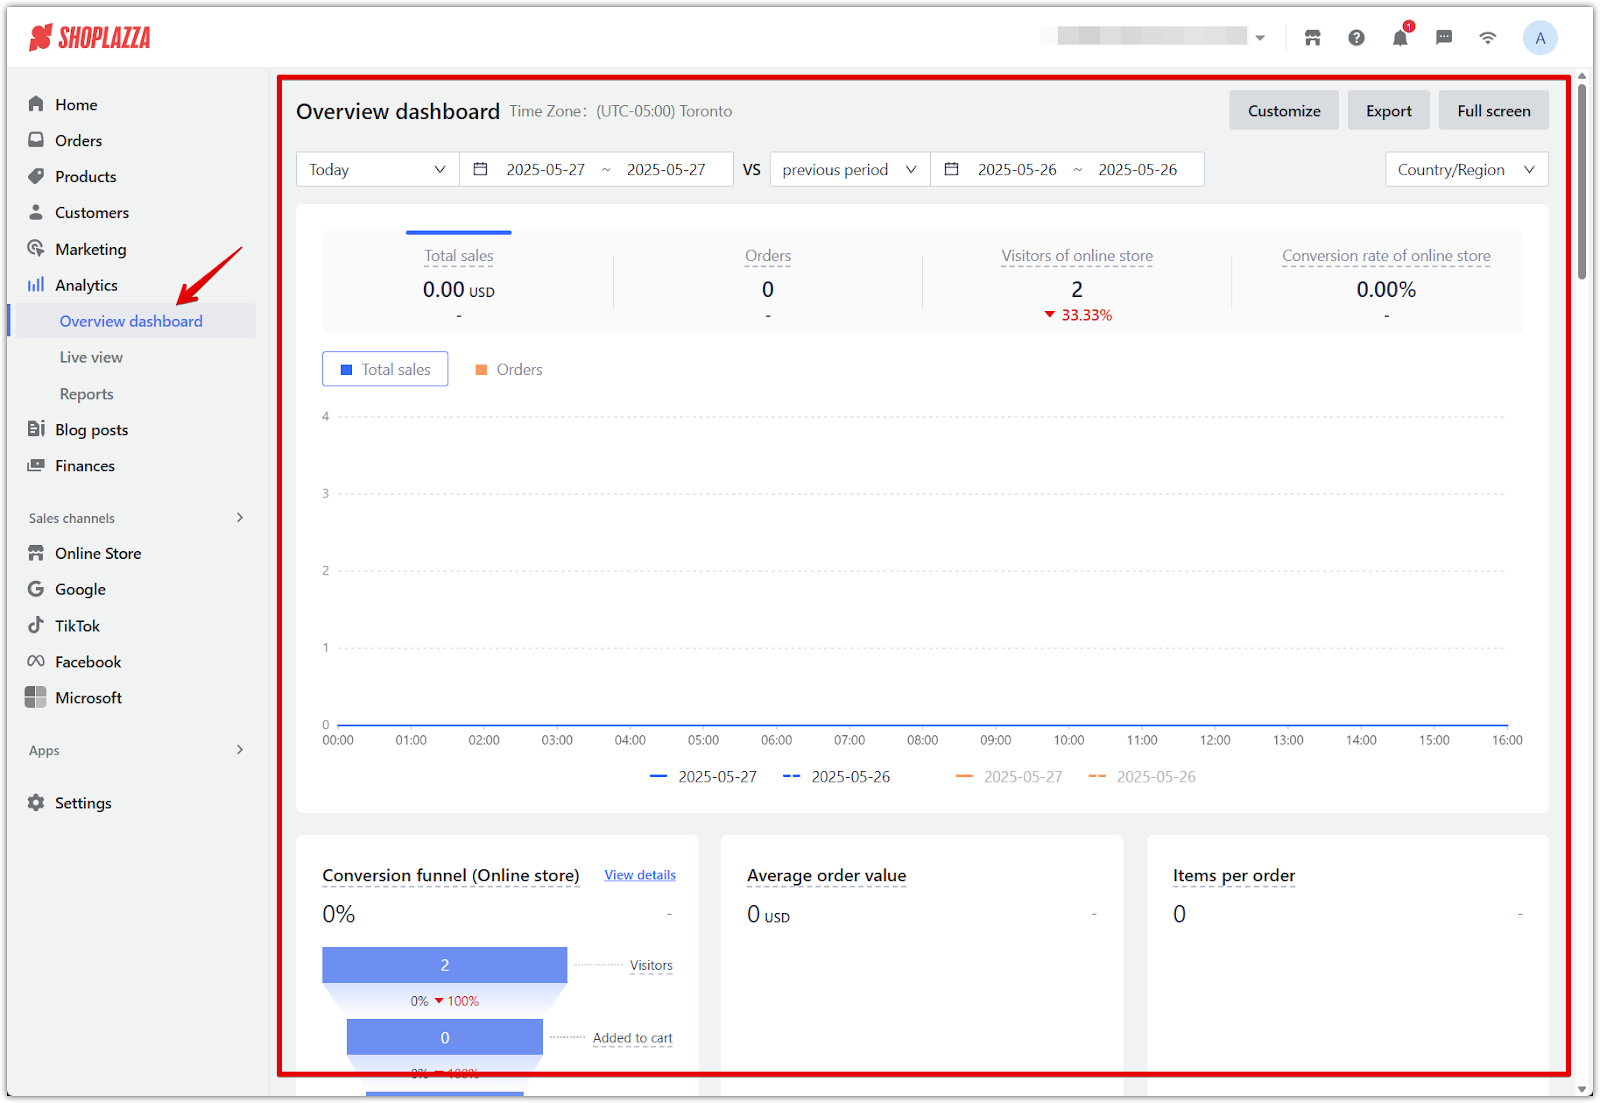
1. Monitor headline metrics: View your total sales, orders, visitor counts, and conversion rate for the selected date range.
2. Track activity trends: Use the line chart to monitor hourly traffic and sales fluctuations, helping you spot patterns throughout the day.
3. Analyze funnel performance: Review the conversion funnel to see how many visitors add items to cart and complete purchases. This highlights potential drop-off points in the customer journey.
4. Review order behavior: Check average order value, items per order, and repurchase data to evaluate customer spending habits and repeat business.
5. Understand customer sources: See traffic sources, geographic data, and device usage to better target campaigns and improve user experience.
6. Evaluate product performance: Identify your top-performing products based on views, sales, and add-to-cart activity.
7. Examine bounce rates and landing pages: Identify high-exit pages and improve them for better retention.
8. View internal search behavior: See what customers are searching for by using the Search Source and Keyword panels to better tailor your product offerings.
Live view
Stay updated on current visitor activity and real-time store performance.
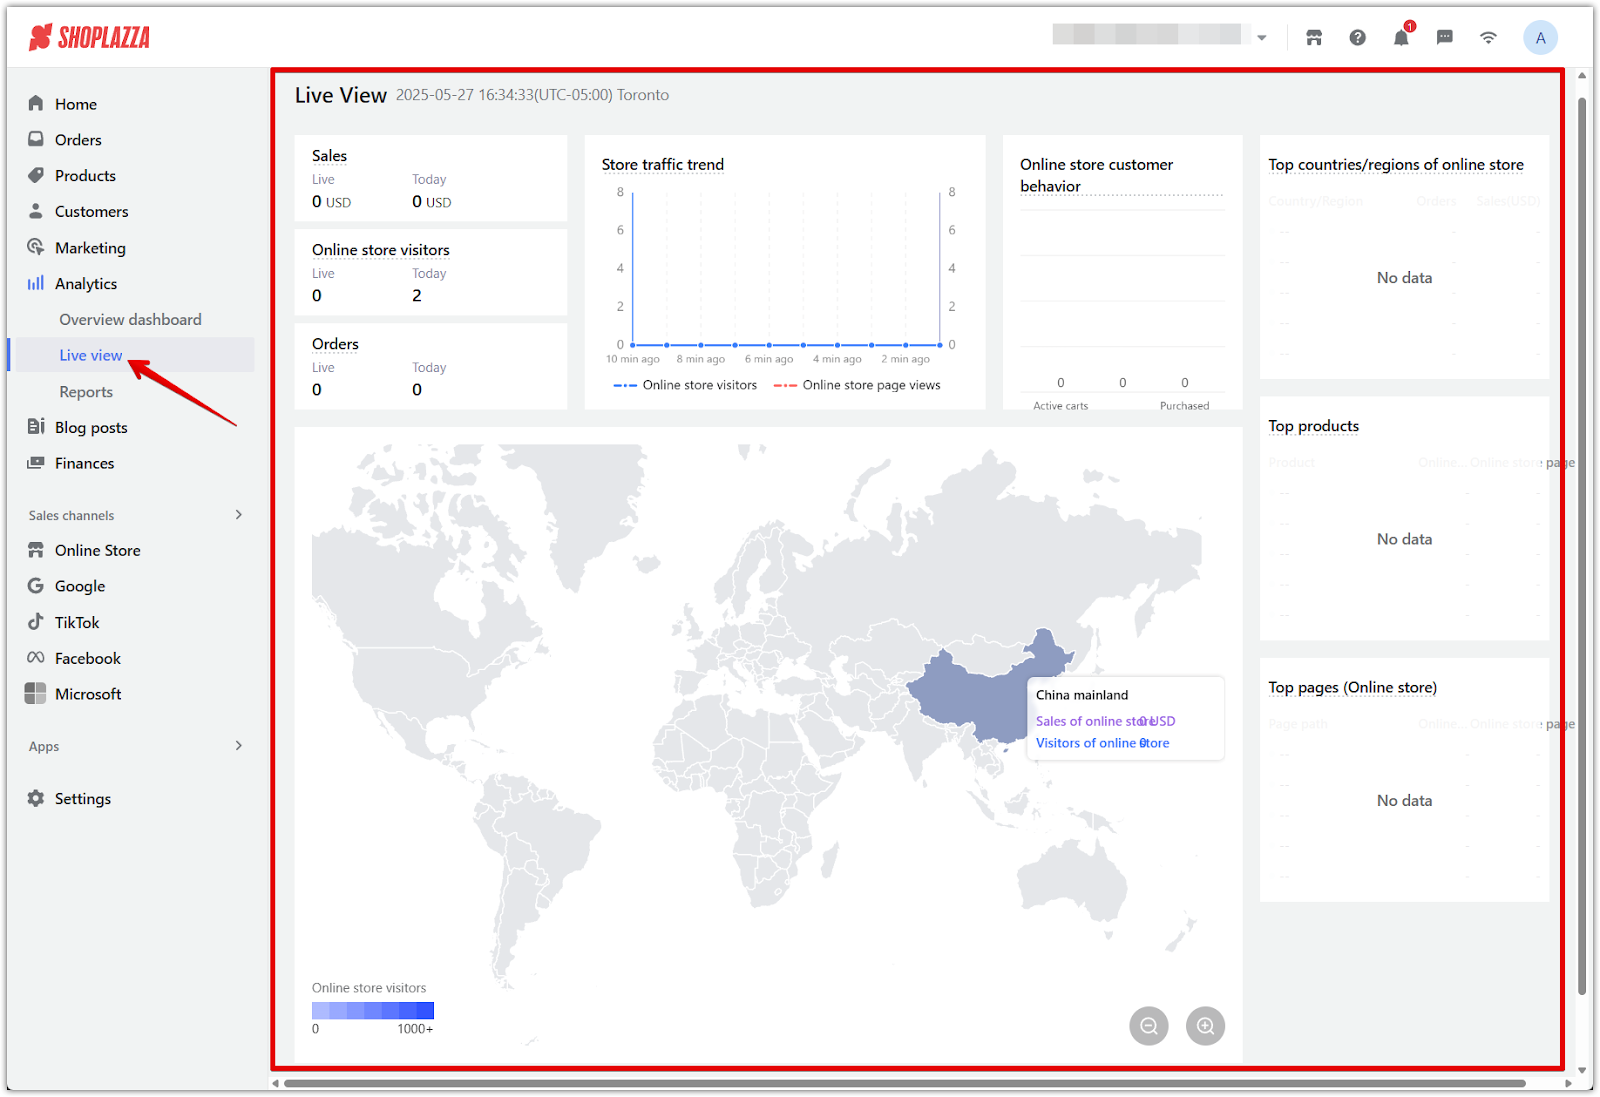
1. Track visitor behavior in real time: See how many visitors are currently browsing, which pages they’re on, and which products are being viewed.
2. Monitor ongoing transactions: Watch real-time sales activity as orders are placed and processed throughout the day.
3. Spot demand surges: Use Live view to identify spikes in traffic during promotions or product launches and respond accordingly.
Reports
Dive deeper into performance metrics with customizable, exportable reports.
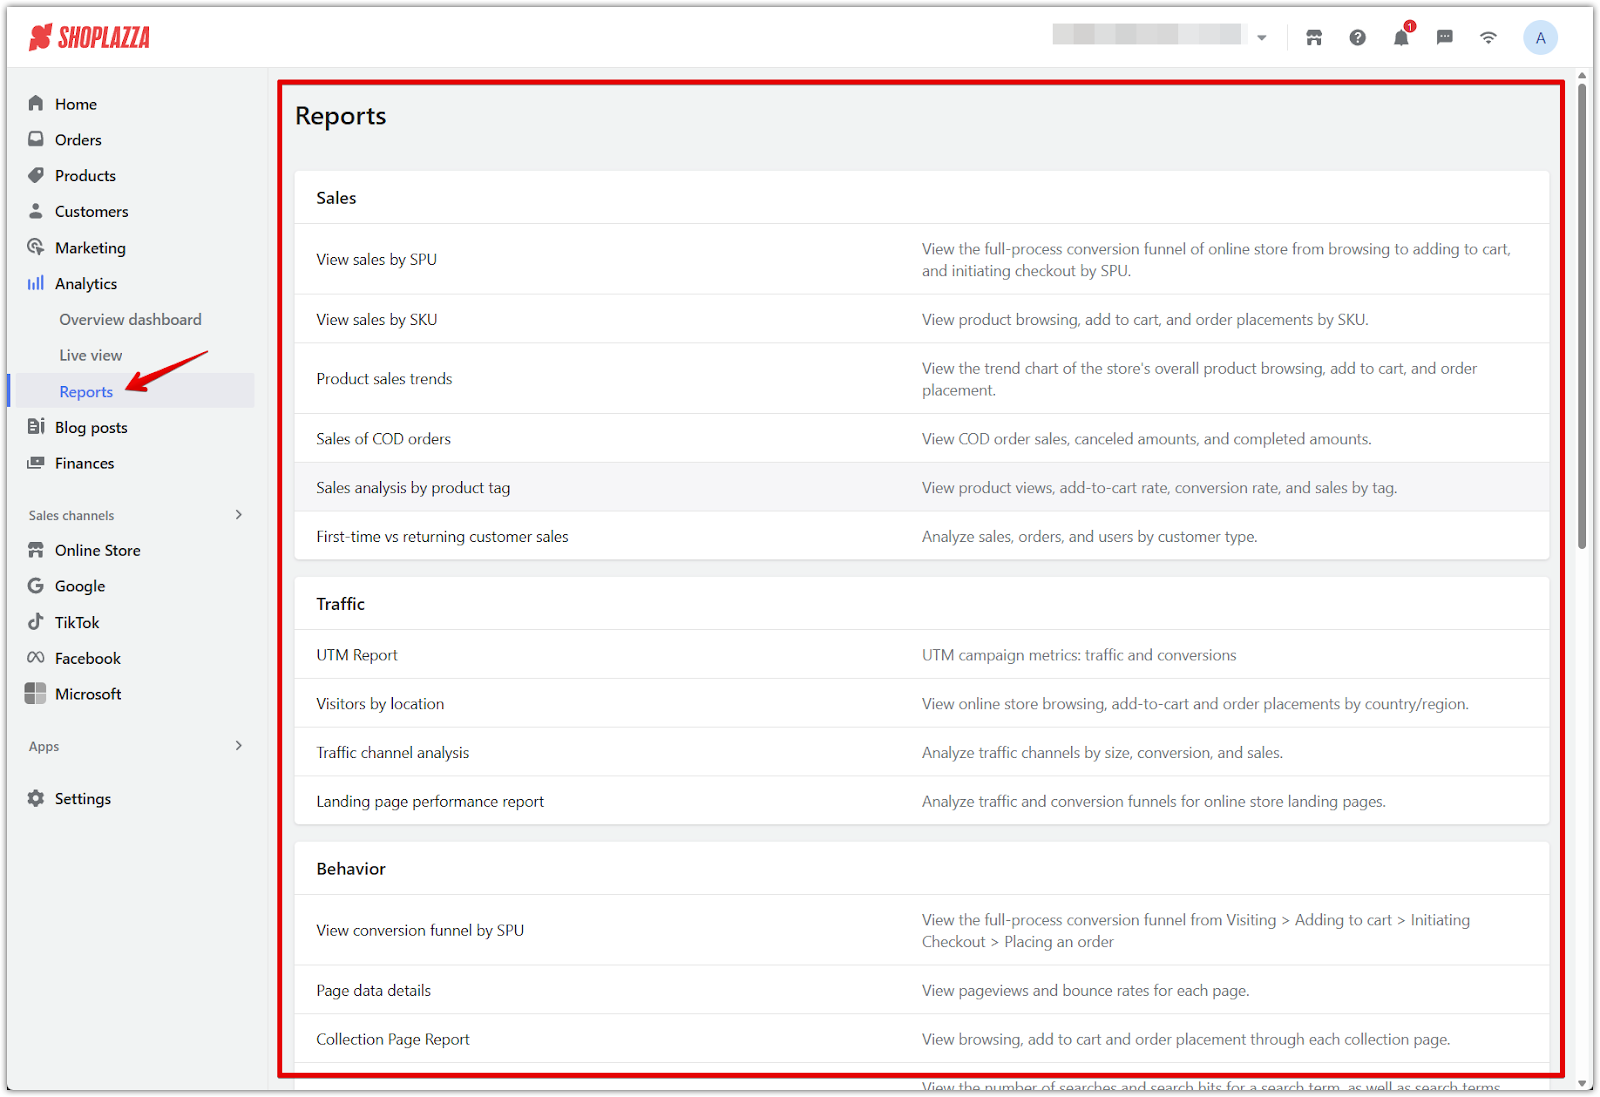
1. Generate performance reports: Create customized reports for sales, traffic, products, orders, and customer behavior based on specific time ranges.
2. Use reports for planning: Review historical data to guide quarterly reviews, inventory planning, and marketing evaluations.
3. Export and share insights: Export report data for internal reviews, presentations, or financial reporting.
The Analytics section provides powerful tools to help you monitor performance, understand your customers, and make informed decisions. Whether you're tracking sales in real time, analyzing visitor behavior, or generating detailed reports, these insights support long-term growth and smarter business strategies. Check your analytics regularly to stay aligned with your goals and uncover new opportunities for store optimization.


Comments
Please sign in to leave a comment.