Sold out rate reports provide valuable insights into customer demand and assist in efficient inventory management. These reports play a crucial role in facilitating informed business decisions. By showcasing sold out rate figures and highlighting trends and patterns of customer behavior, they empower you to make strategic choices that optimize your operations. With a clear understanding of customer demand and inventory performance, you can effectively plan stock levels, identify popular products, and ensure seamless customer experiences.
Viewing your sold out rate report
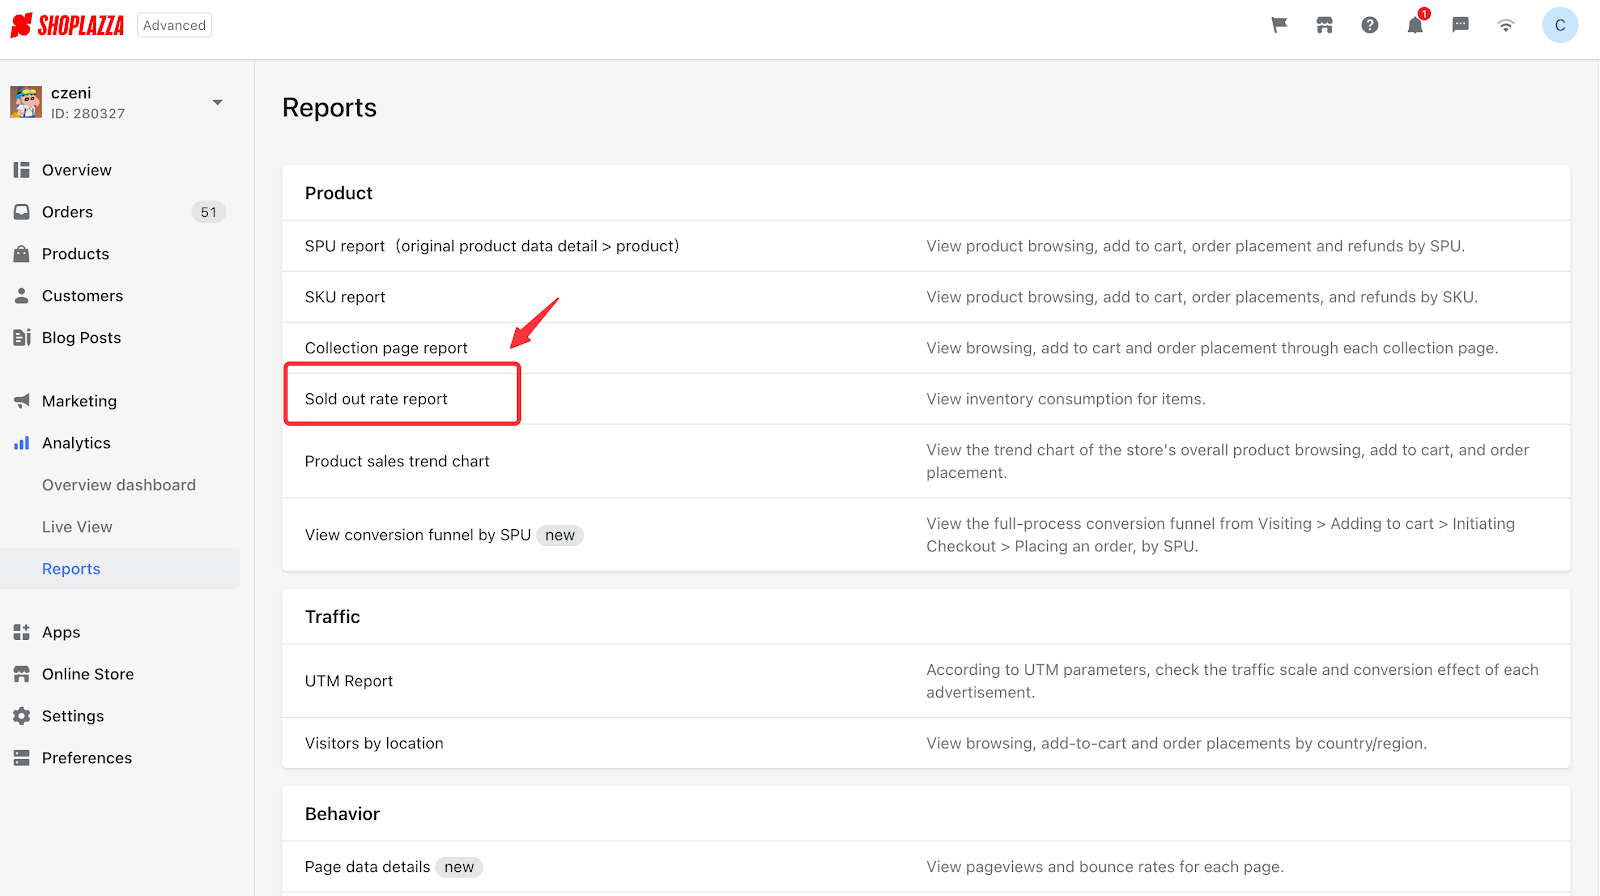
1. You can access your sold out rate report at Shoplazza Admin > Analytics > Report > Product > Sold out rate report.
Selecting time-frame indicators
1. Click on the time filter to select a preferred timeframe.
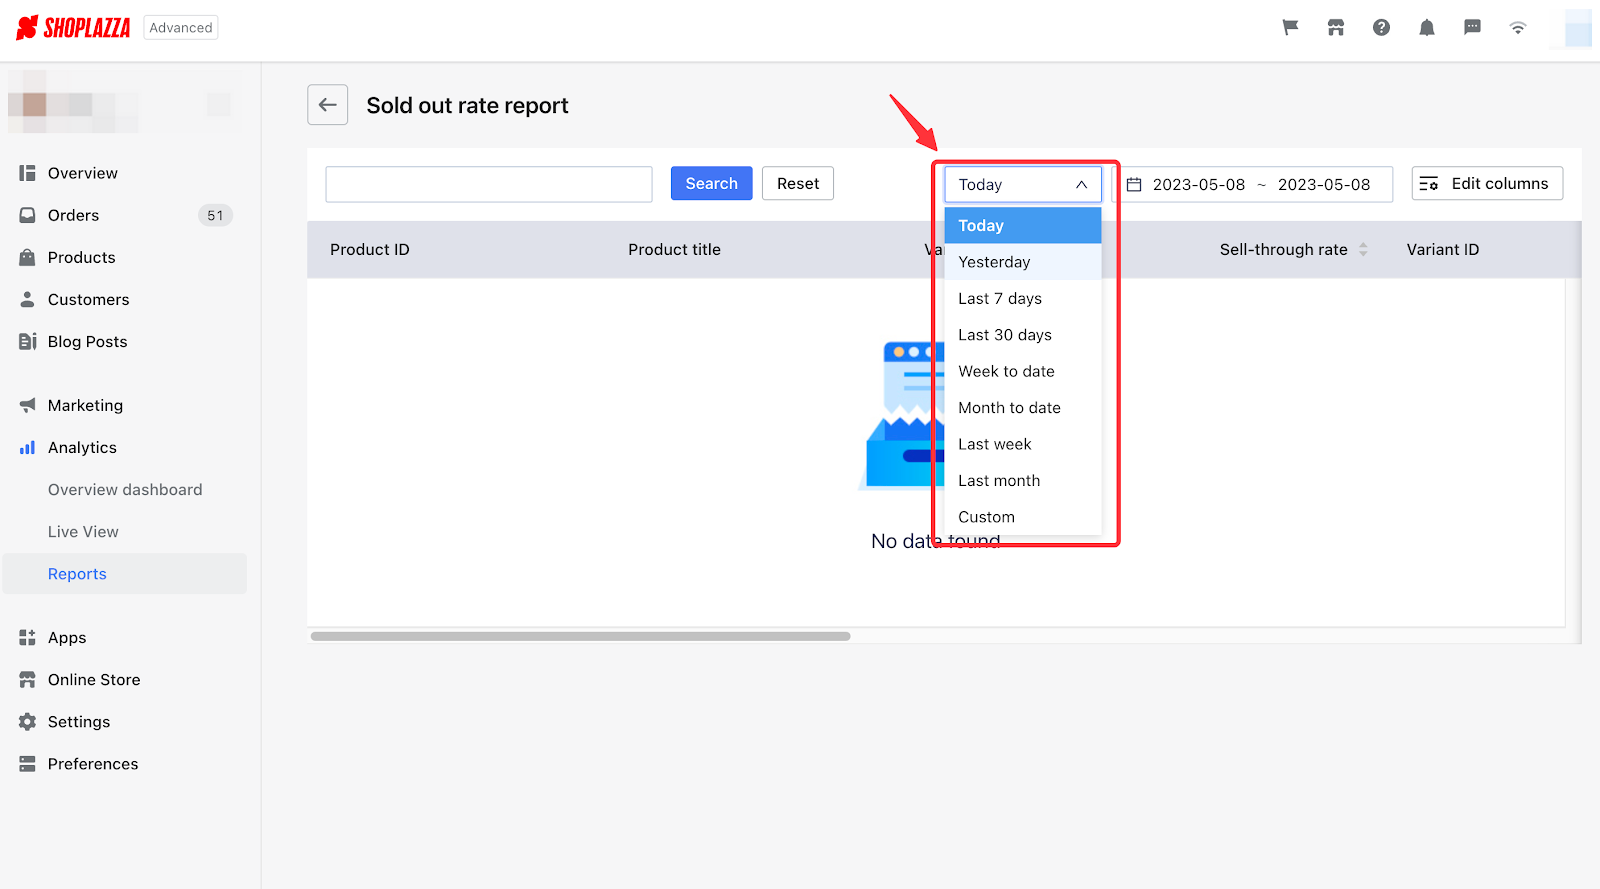
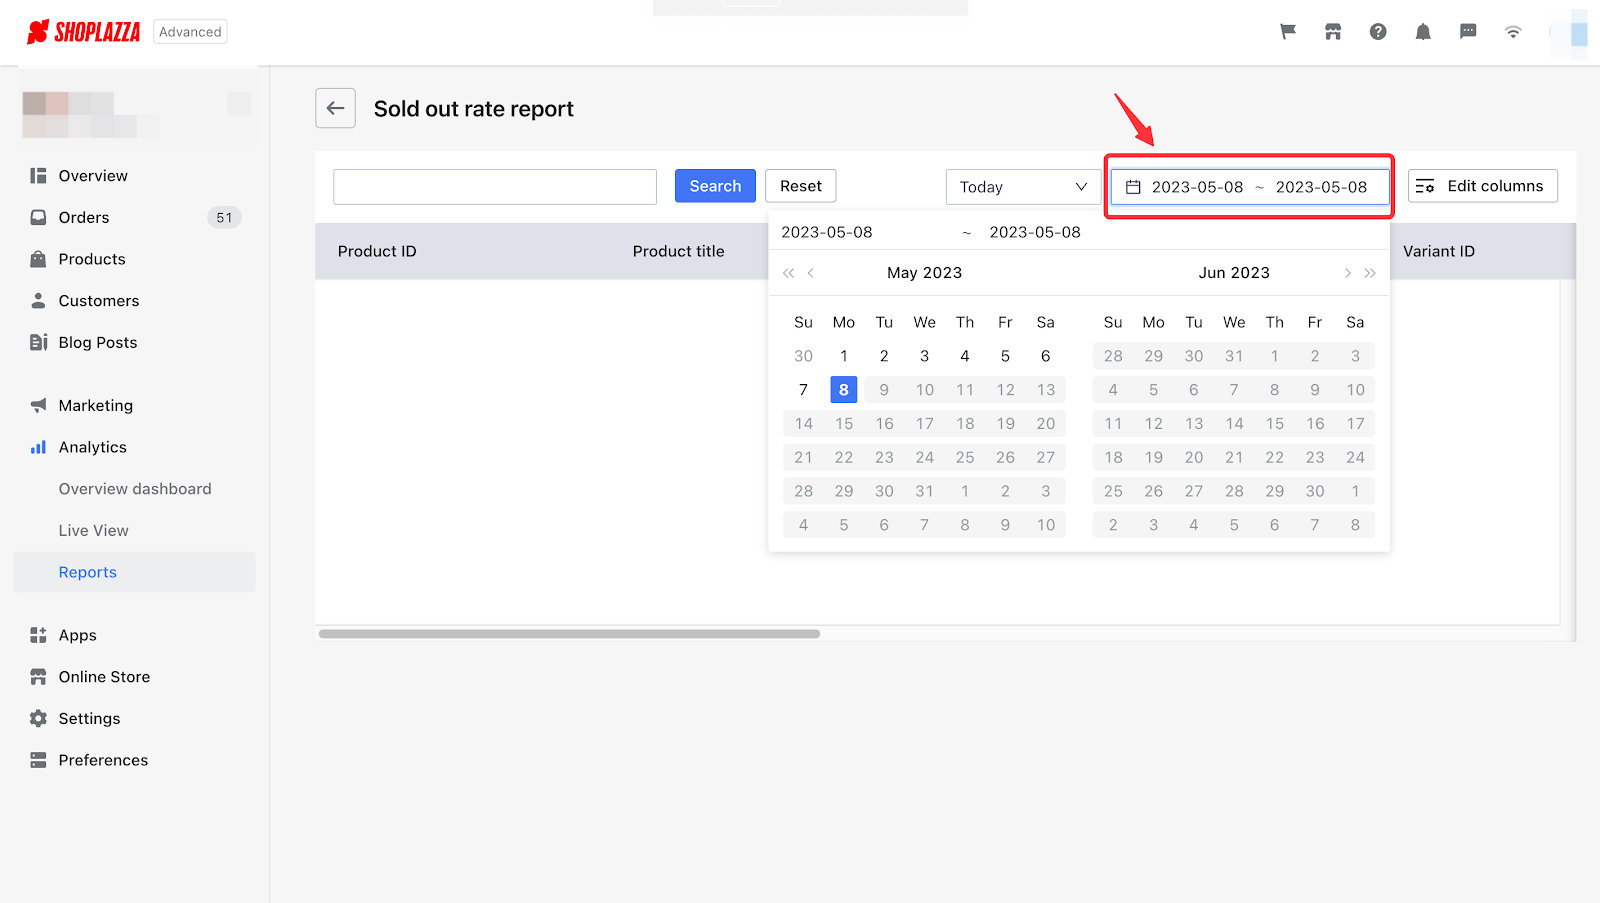
2. Choose the Custom option from the drop-down menu if you would like to personalize your report.
Note
Your sold out report will display today's data by default (from 0:00 am to the moment you click on the report if no options have been selected.
Searching for a specific product
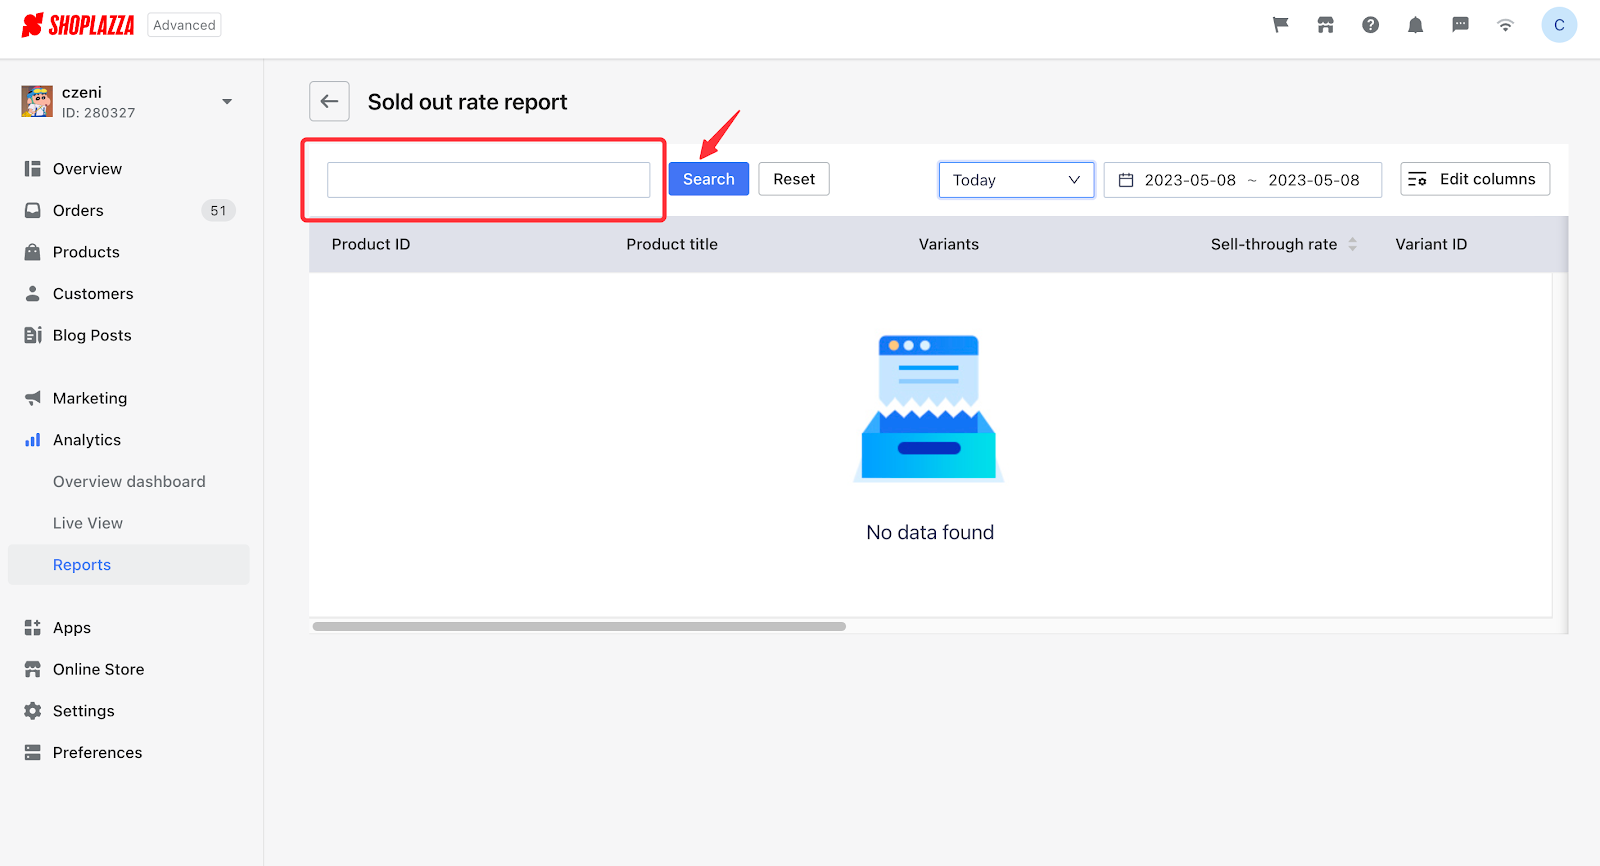
1. Check out the sold out figures of a specific product by tying the product name in the box above and clicking on the Search button beside it.
Viewing sold out report elements in a customized order
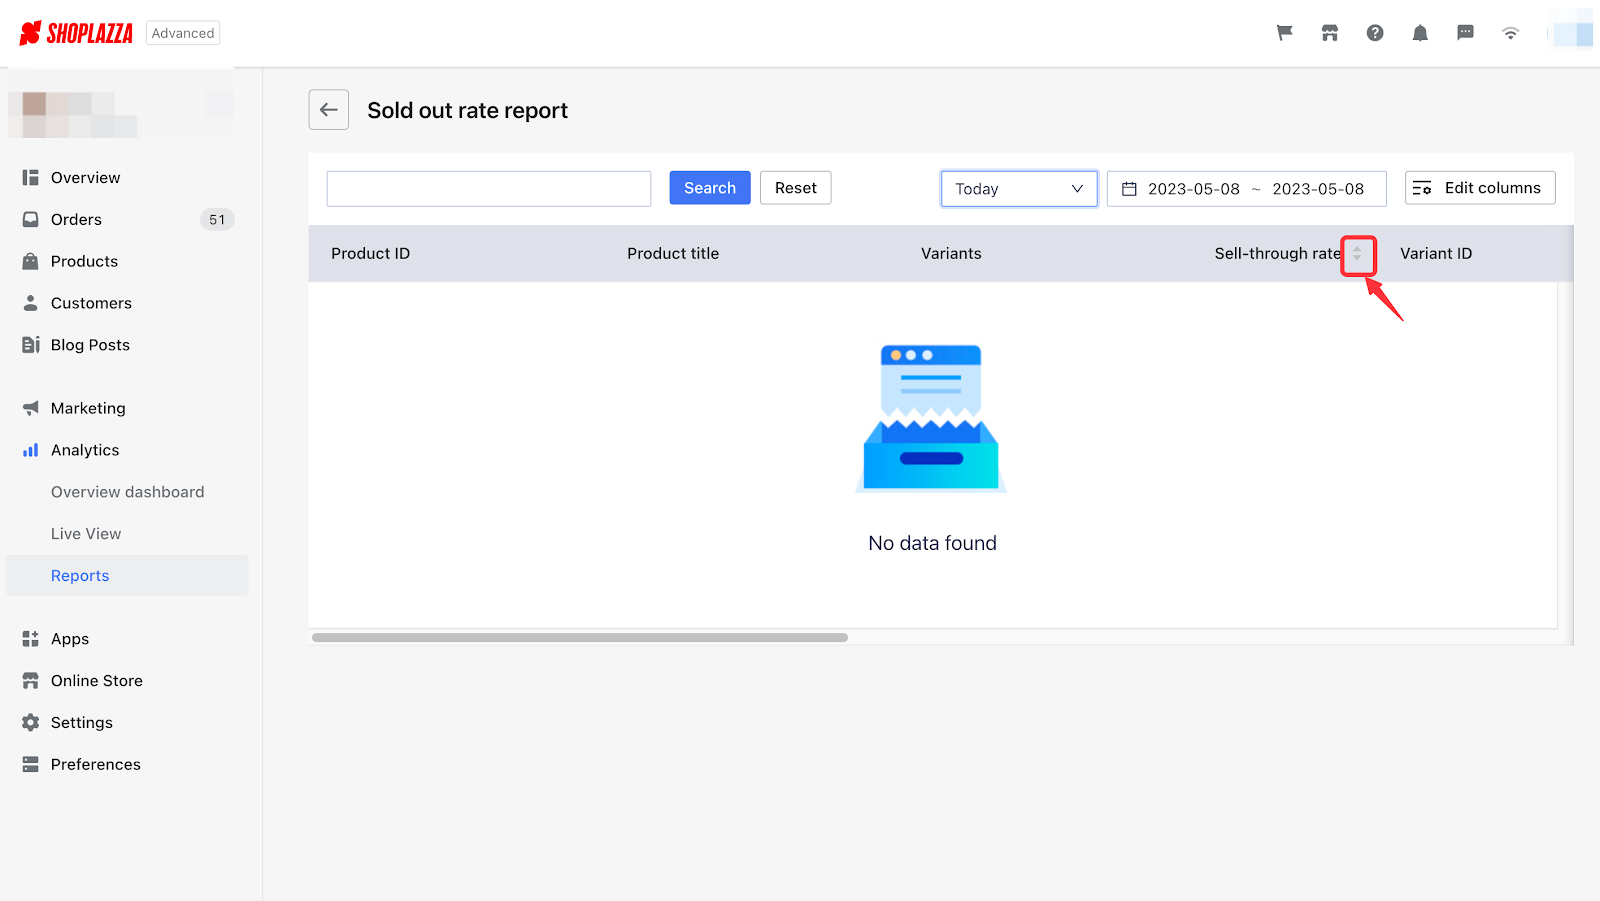
1. Clicking on the arrows beside the headers will allow you to sort your search results by ascending or descending orders.
Editing your columns
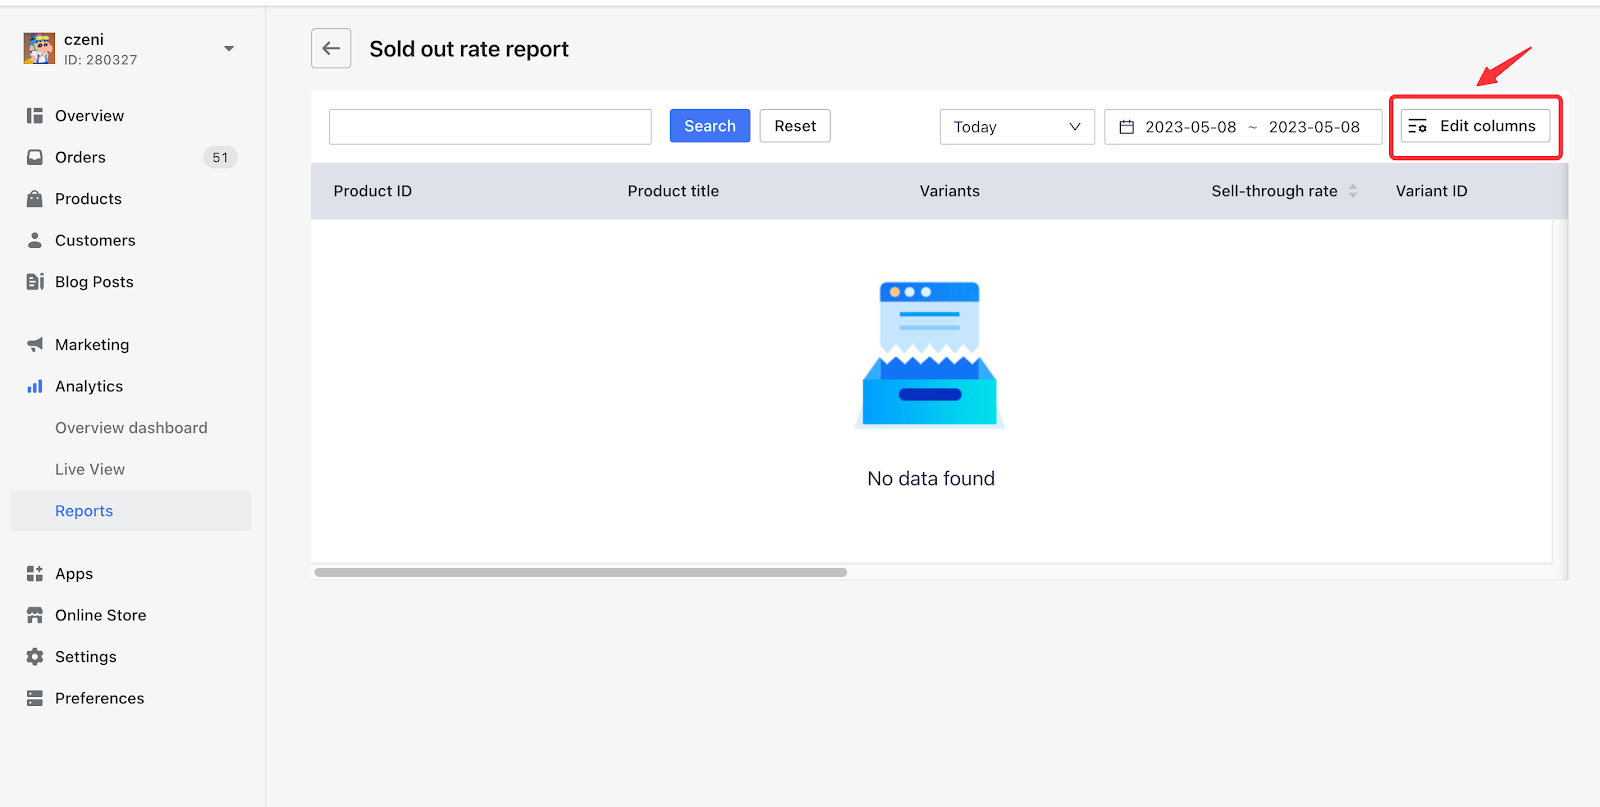
1. Refer to Edit columns if you would like to customize the report.
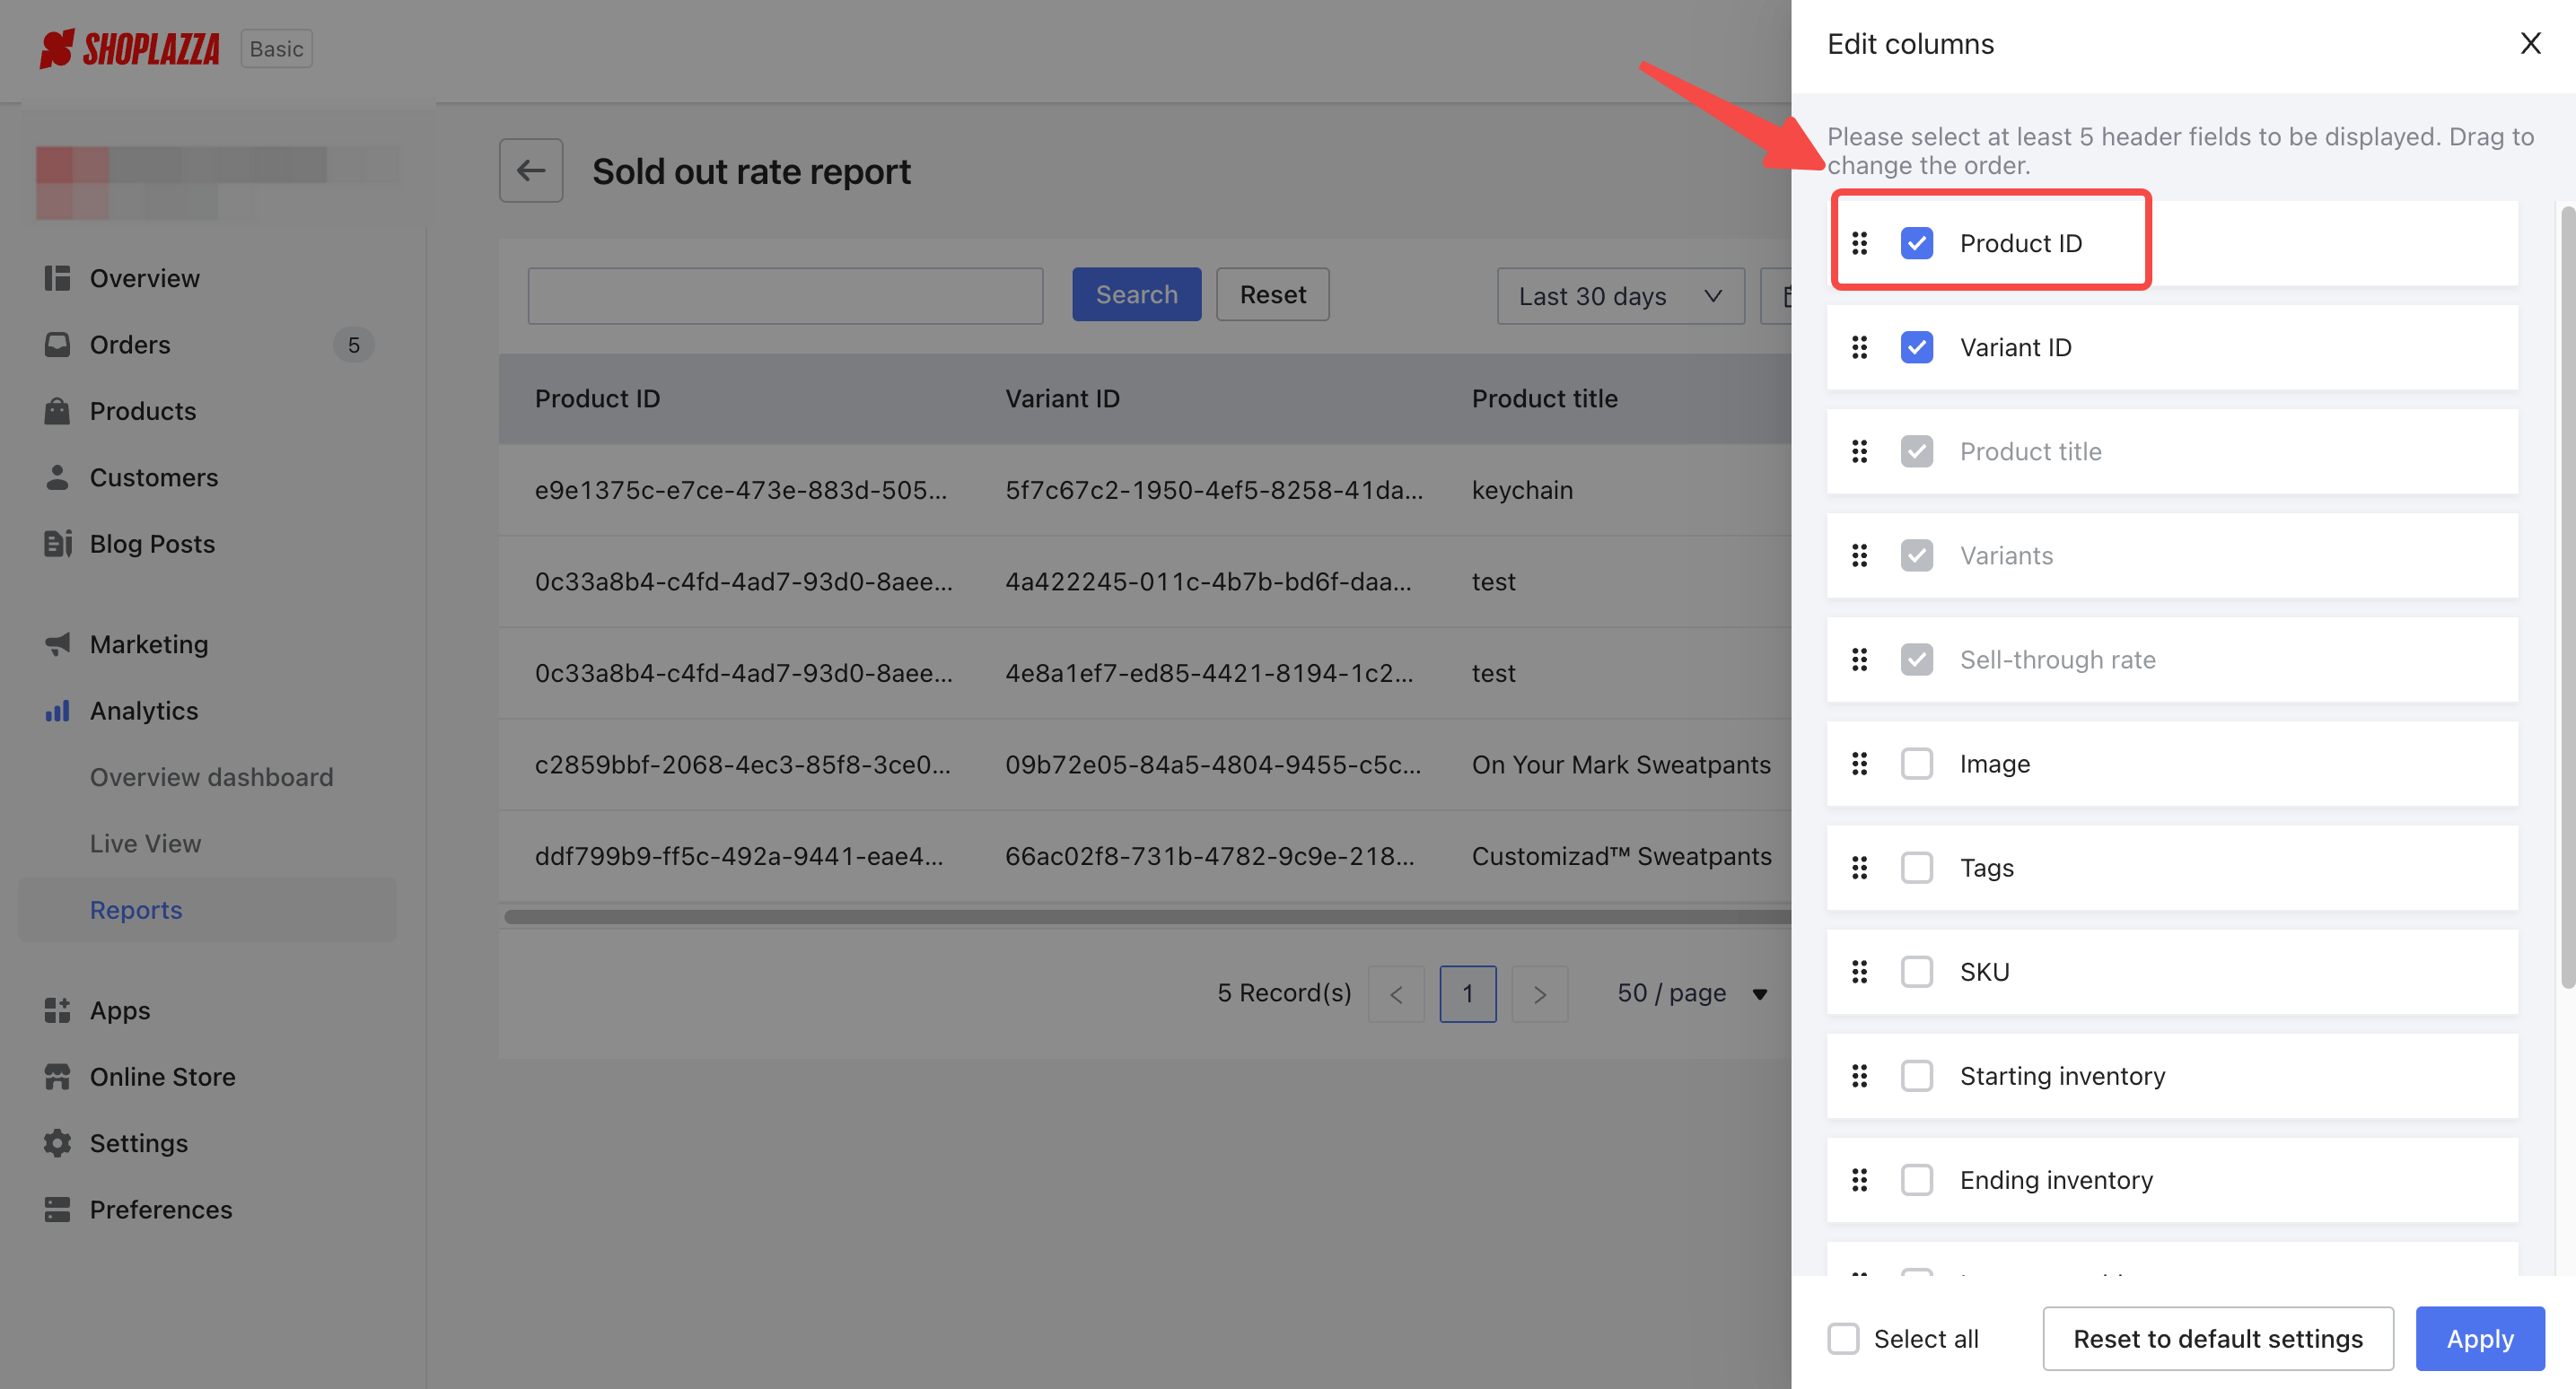
2. Enable indicators by checking the boxes to include information displayed in the report.
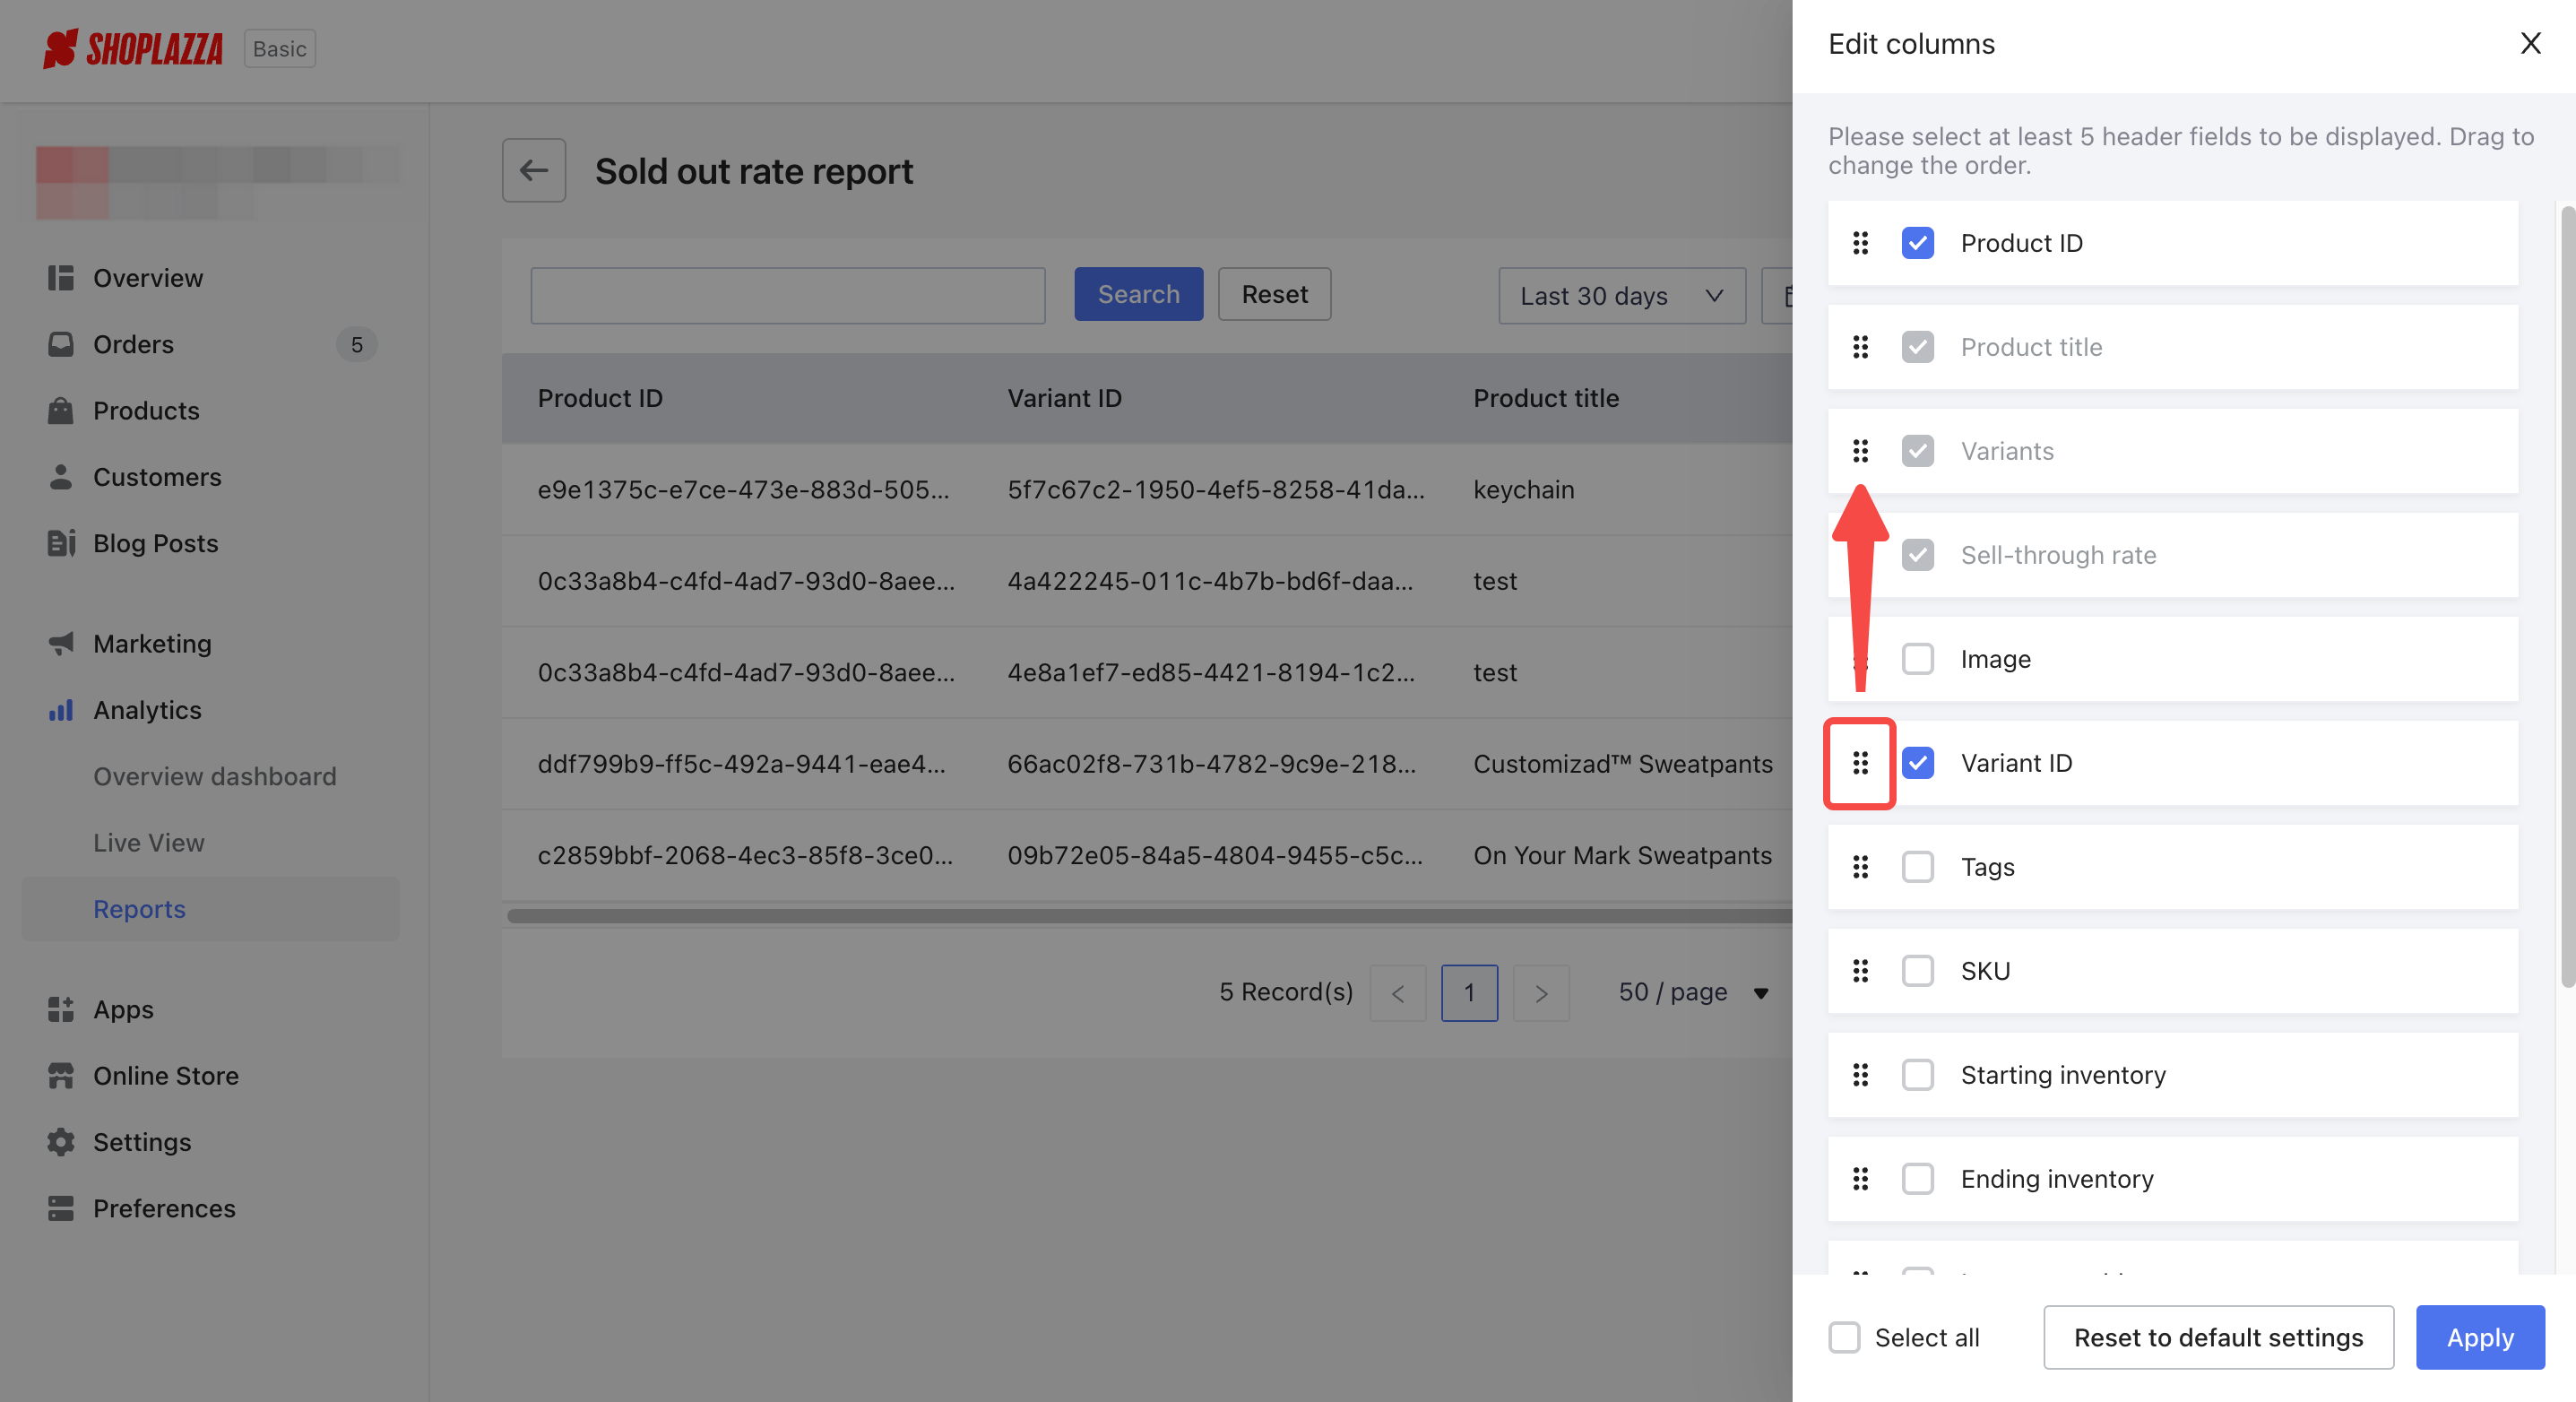
3. You can also drag the buttons in front of the checkboxes and switch the order of the chart elements displayed in the chart.
In the chart below, you can identify the meanings of every indicator in your sold out report:
| Indicator | Definition |
| Product ID | A unique number identifier assigned to your product to help you distinguish one from another. |
| Variant ID | Unique identifier assigned to a specific variant of a product. |
| Product title | Name title given to a specific product. |
| Variants | Specific variation or option of a base product. |
| Sell-through rate | Units sold / (Units sold+Ending inventory) |
| Image | Included image resources for a specific product. |
| Tags | A label attached as identifier to a specific product. |
| SKU | A unique alphanumeric code or number assigned to a specific product to help identify a specific product. |
| Starting inventory | This indicator represents your stock inventory available at the start date with the time frame you select. |
| Ending inventory | This indicator represents your stock inventory available at the end date with the time frame you select. |
| Inventory sold | Number of items sold during the selected time period. |
| Inventory sold per day | Number of inventory sold per day during the selected time period. |
| Percent sold | Inventory sold / stock inventory available at the starting date. |
| Days reported | Number of days with recorded sales. |


Comments
Please sign in to leave a comment.