SKU (stock keeping units) are codes that you can use internally to track your inventory and report on your sales. Instead of SPU which represents a product collection with all those variants in it, SKU simply stand for a specific type of products. SKU report provides various data related to SKUs, which helps you track and analyze the performance of your products. This report gives you valuable insights into metrics such as product views, add-to-cart actions, orders, and refunds specific to each product.
Viewing your SKU report
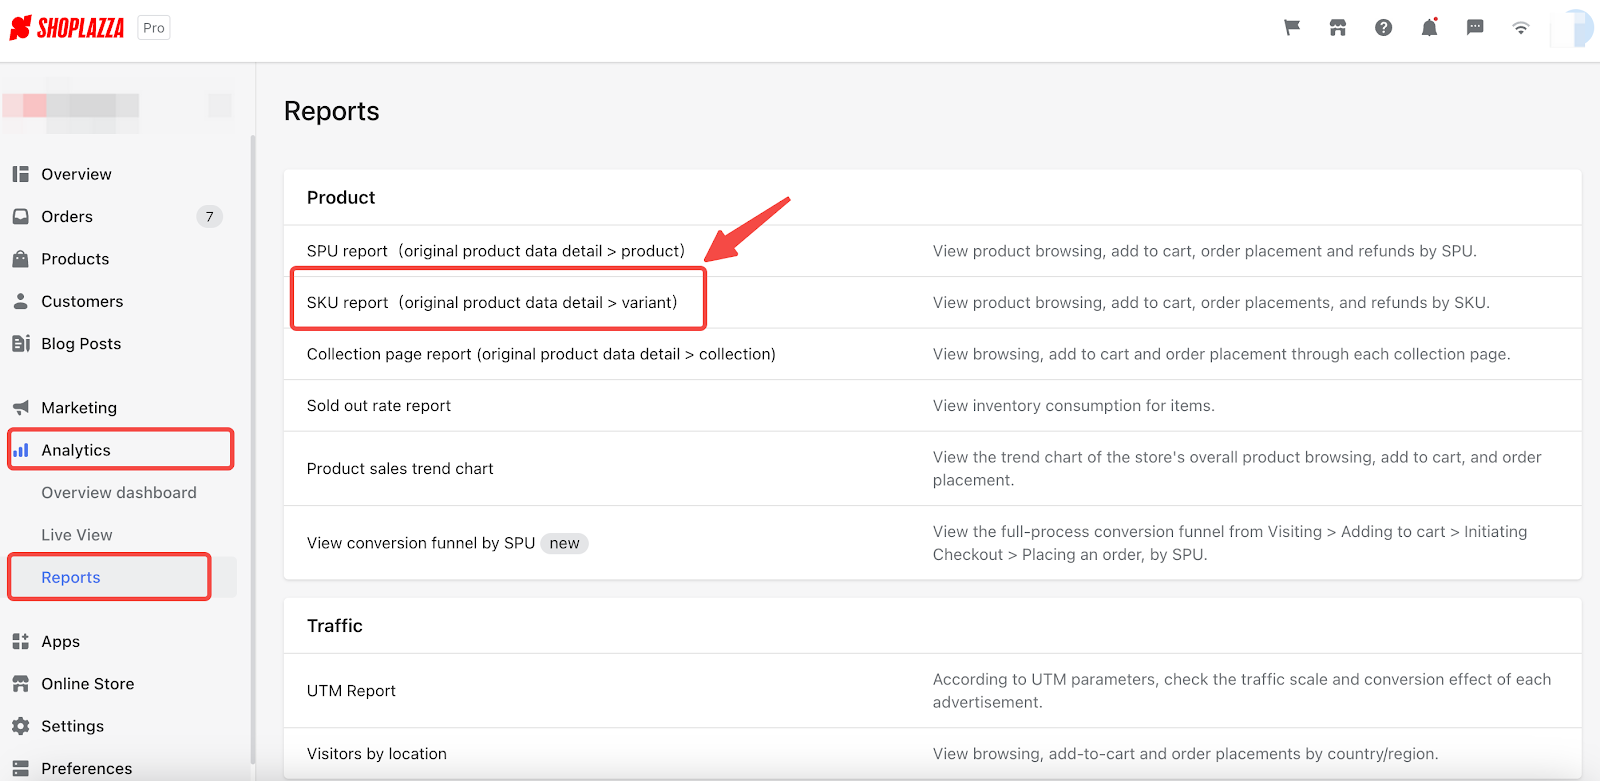
1. You can access your SKU report by going to your Shoplazza Admin > Analytics > Reports. Under the Product section, click on the SKU report.
Filtering your report by date
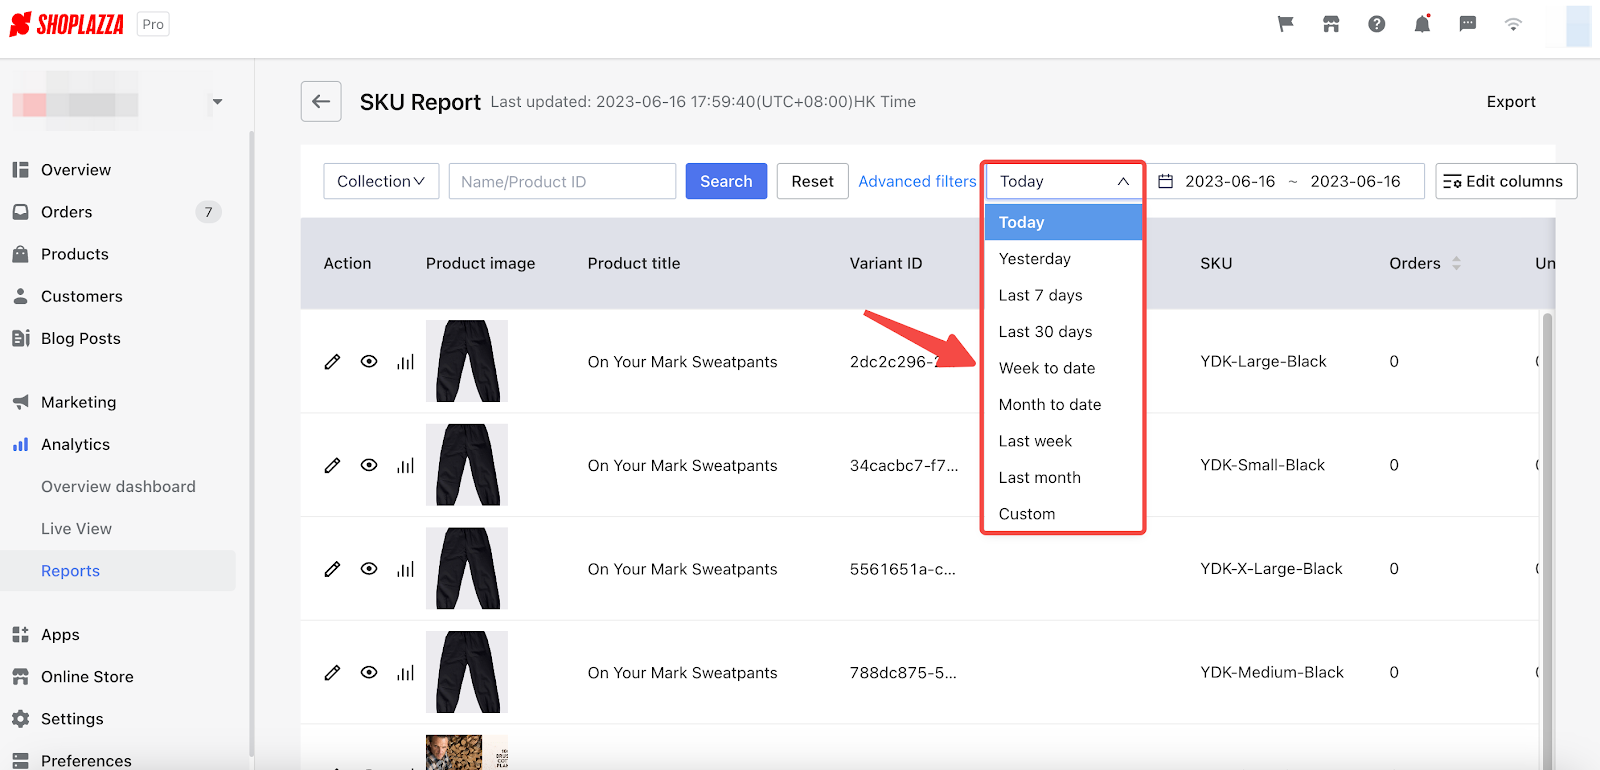
To personalize your report, you can either select the time indicator by clicking on the date column or choose the custom option from the drop-down menu.
Note
Your SPU report will automatically display
today's data (from 0:00 am to the moment you click on the report).
Filtering by product/collection name
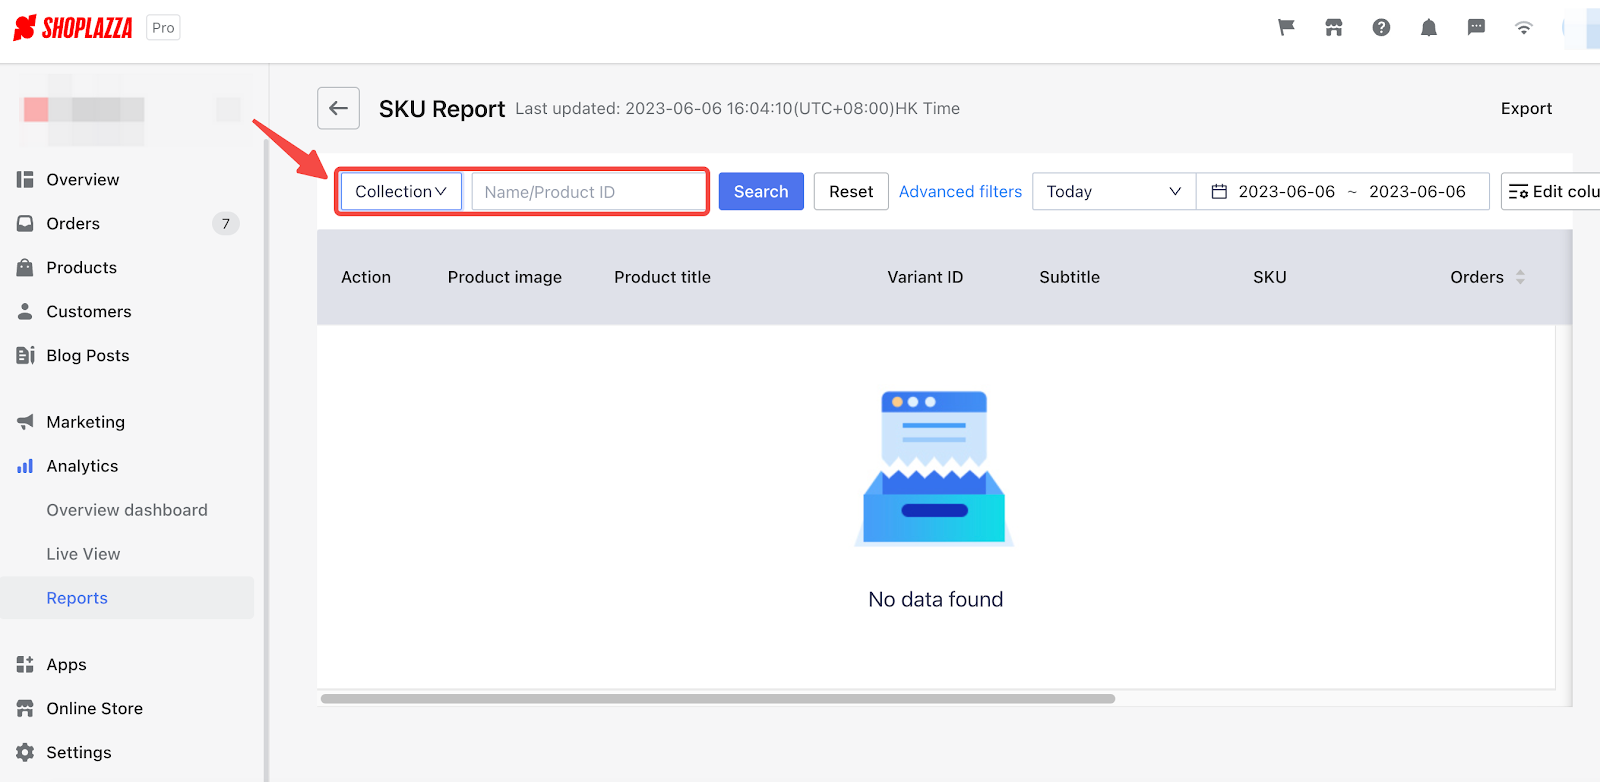
1. To find data for a specific product, simply type the name or ID of the product in the search box. You can also input the collection name to view all the product data in the collection.
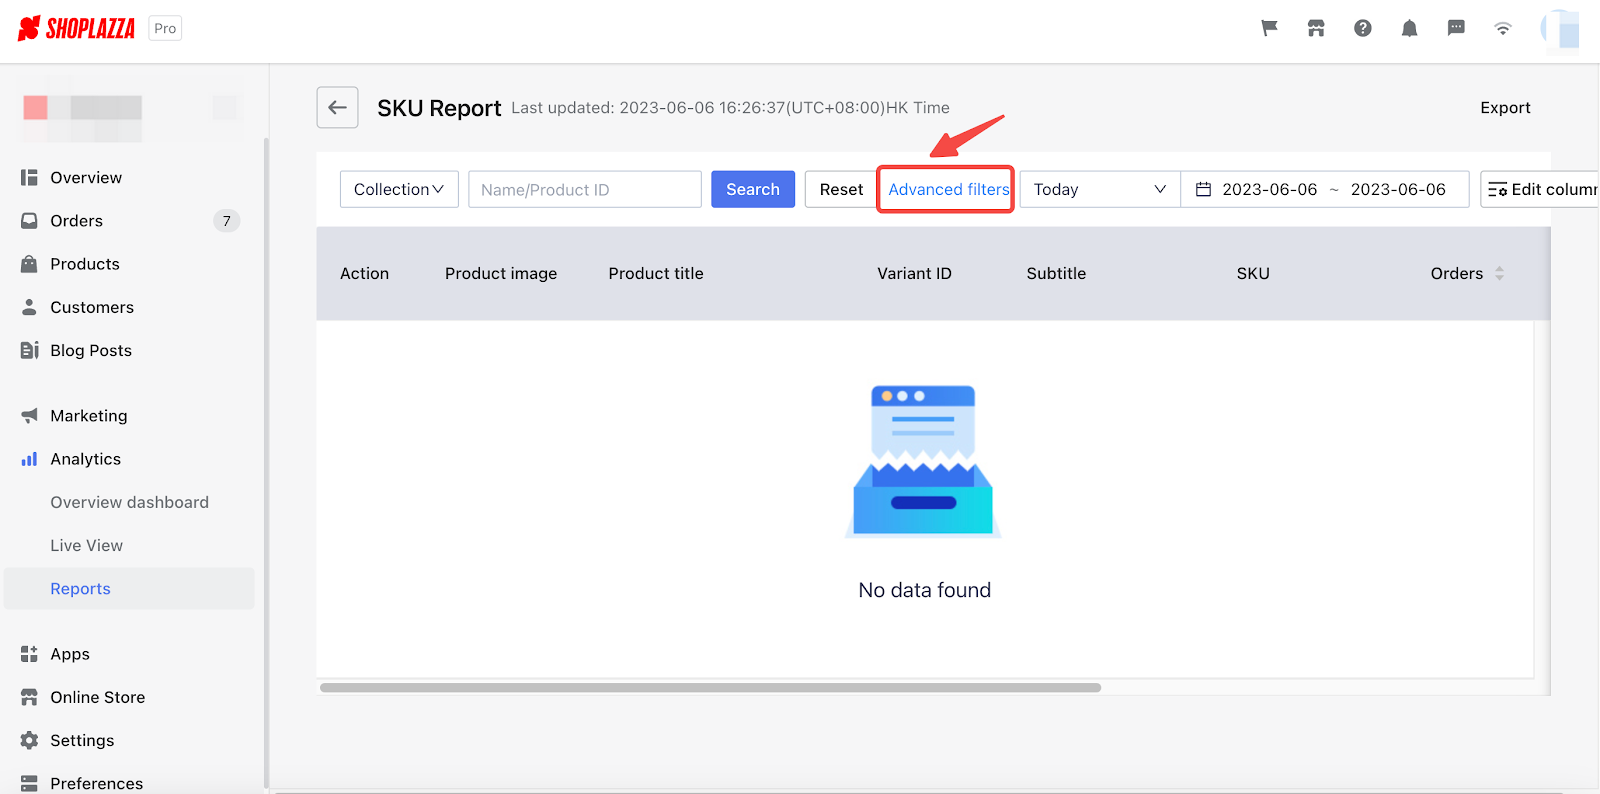
2. To view a specific category of products that meet specific criteria, you can utilize the Advanced filters button to refine the product range.
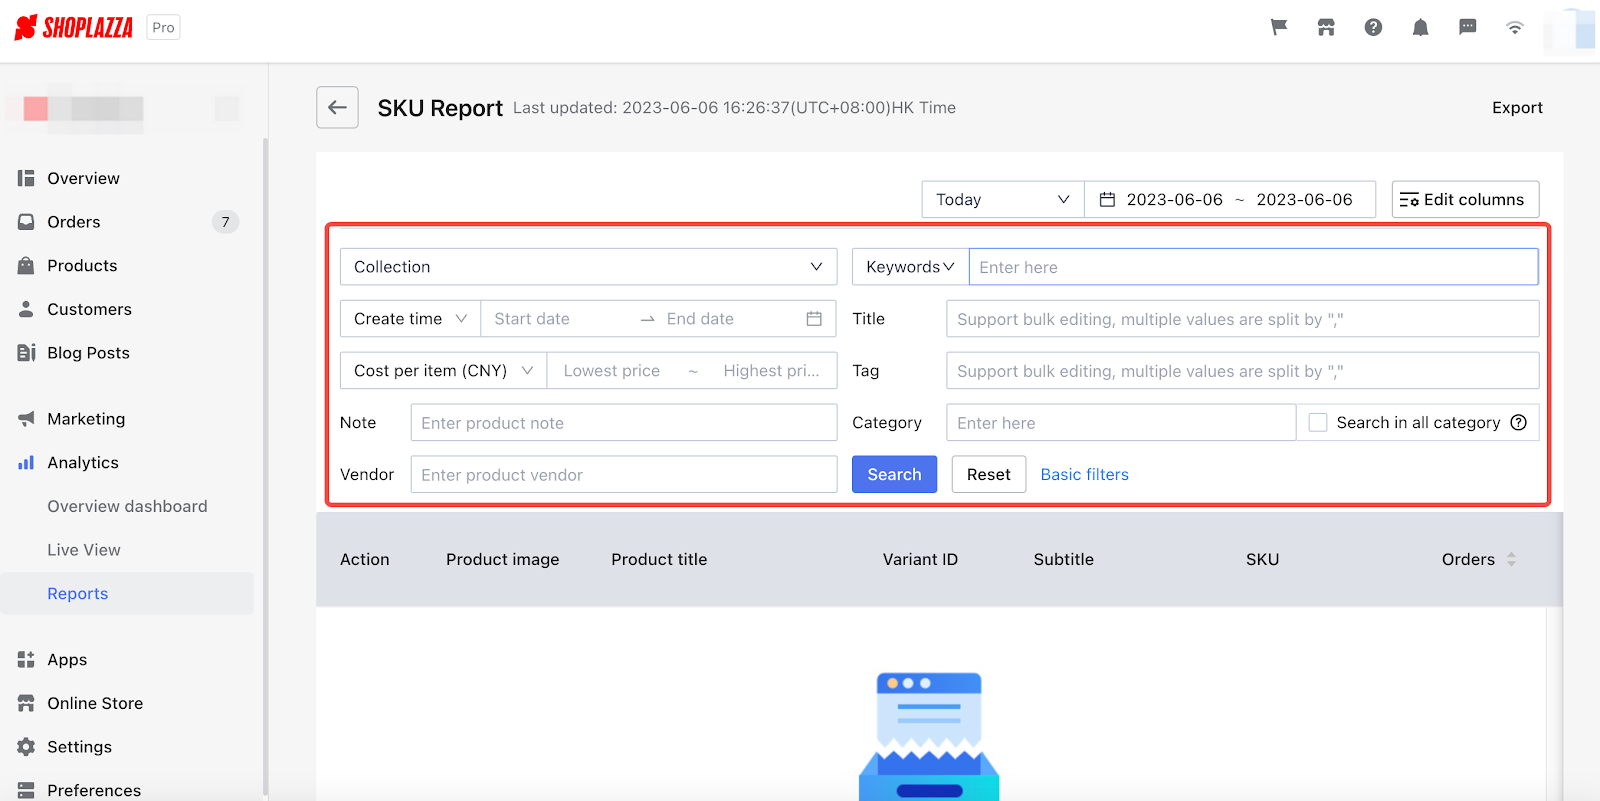
Note
SKU report only displays products with traffic recorded.
For example, new products with no views or sales cannot be displayed in the SKU report.
Sorting your data
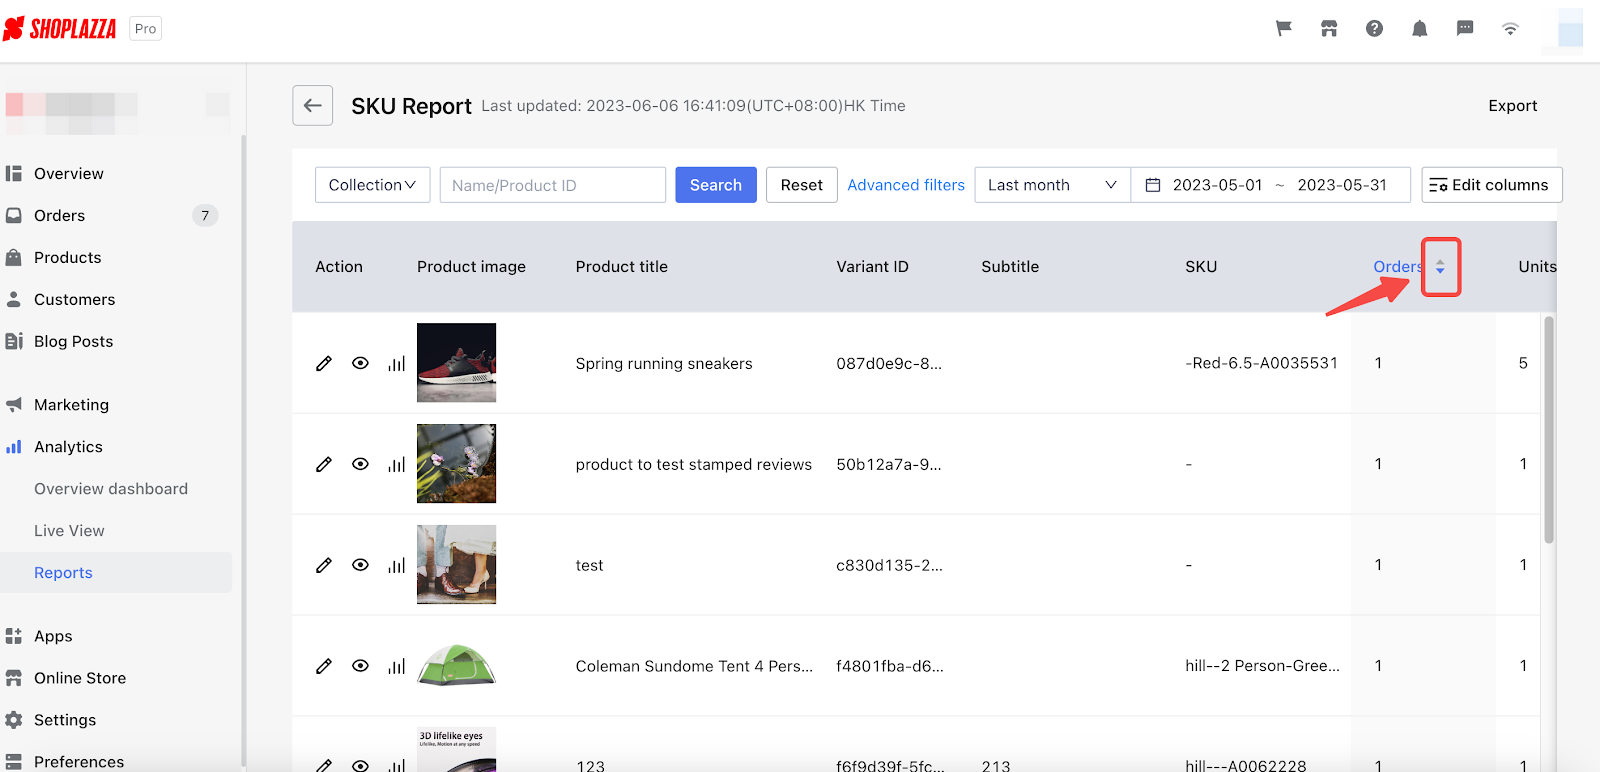
Click on the arrows beside the headers to sort your search results by ascending or descending orders in the chart. (For example, clicking on the arrows beside the header "Orders" and making the arrows go up will sort out the number of orders in ascending order. Conversely, arrows going down will sort out the list of orders in descending order.)
Editing column headers
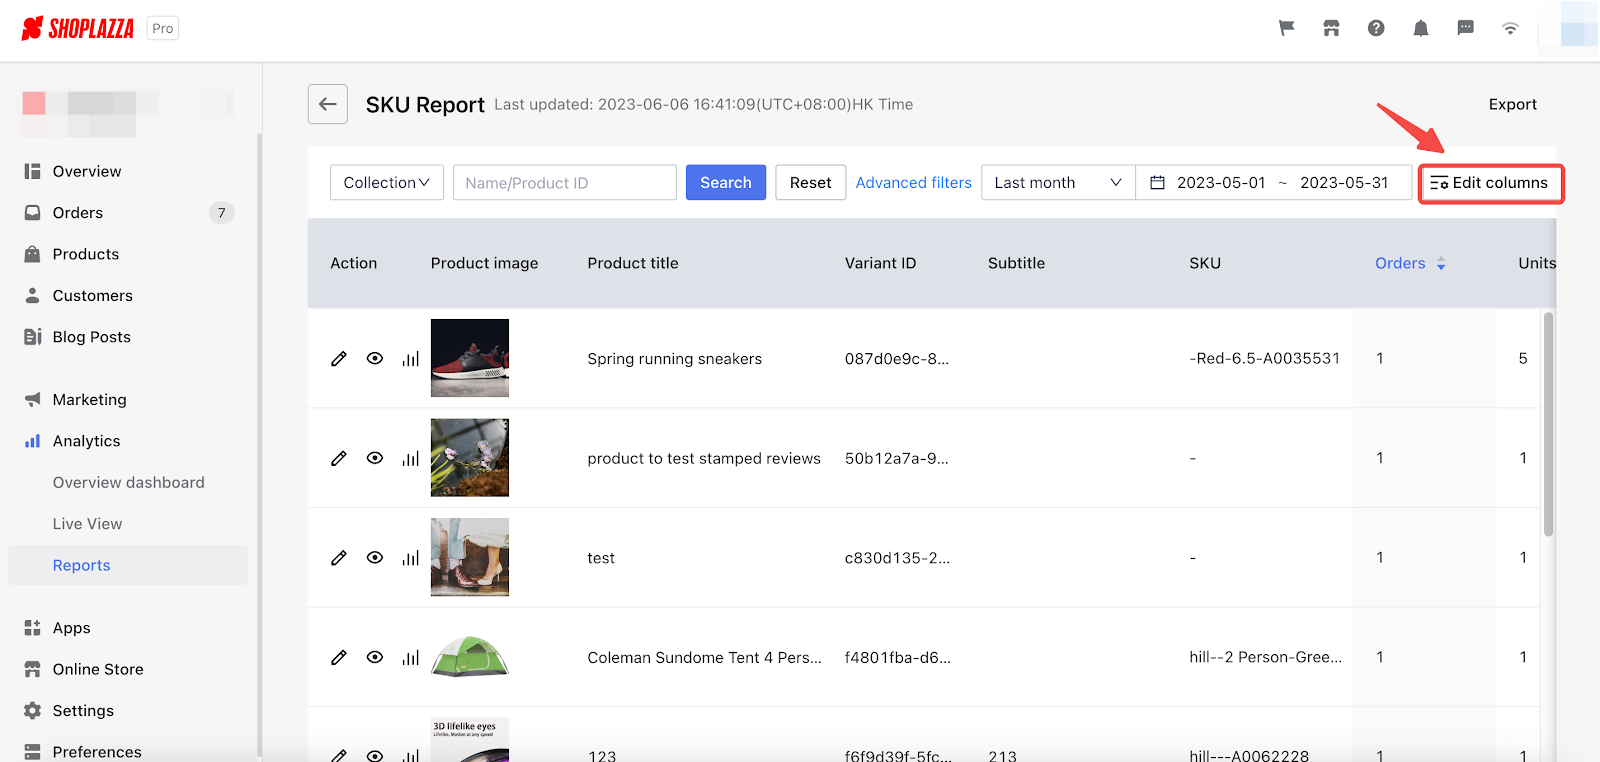
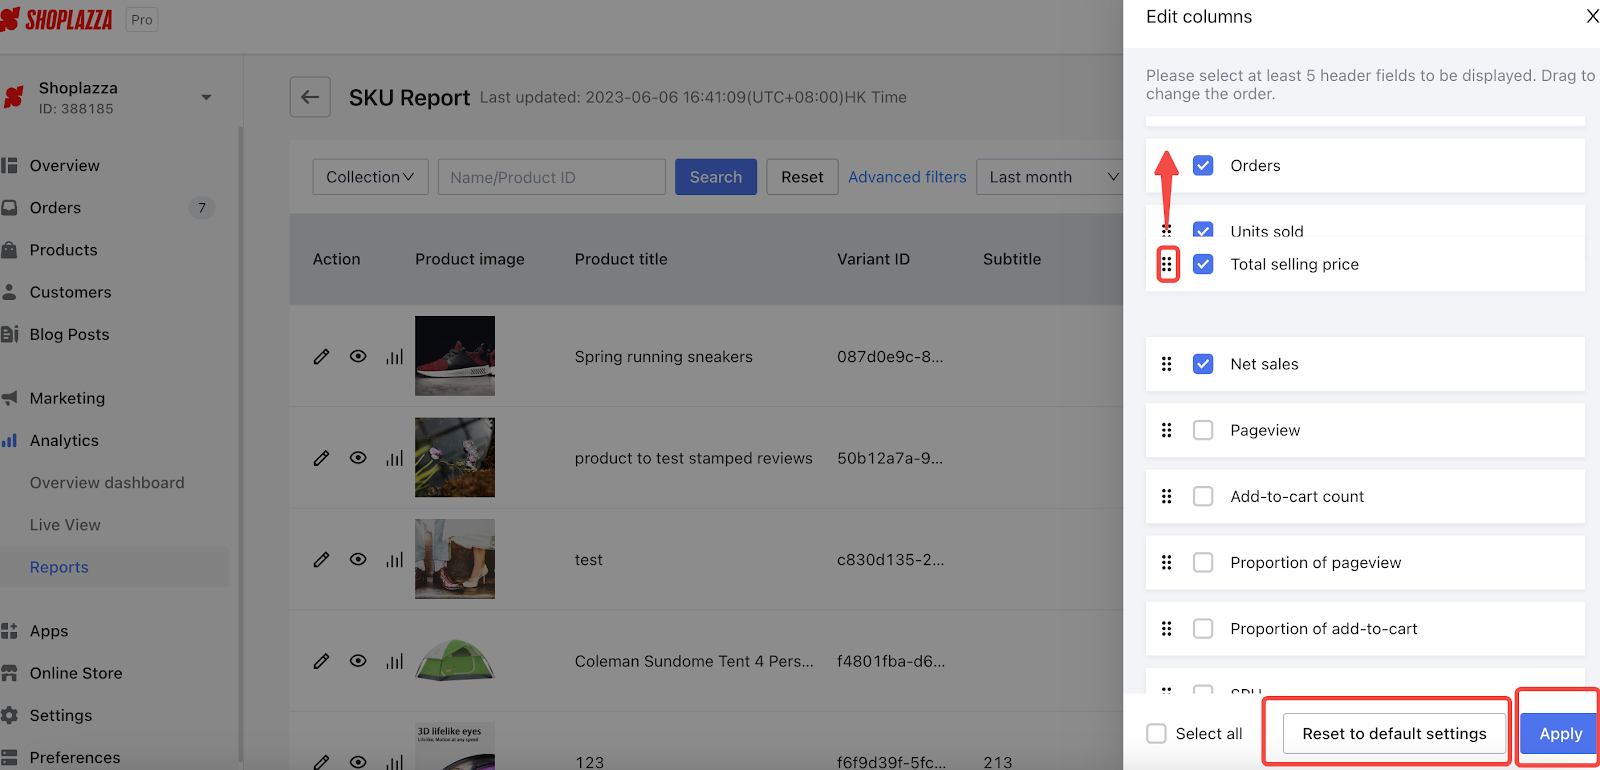
You can edit your SKU report columns and add more headers to display your data in a more comprehensive way.
1. To select the headers displayed in the report, use the Edit header option.
2. Enable indicators by checking the boxes to include information displayed in the report.
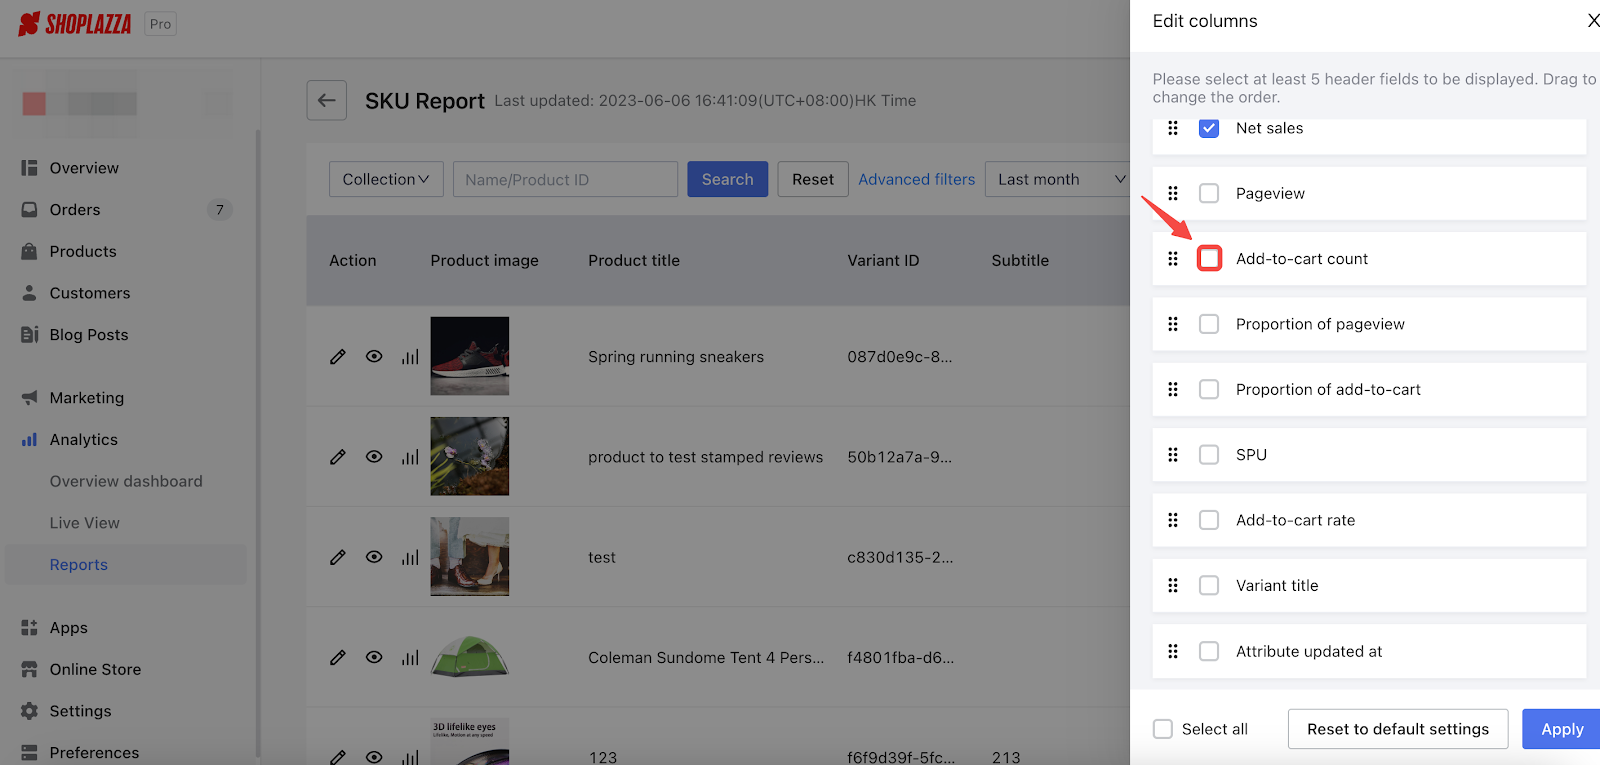
3. Drag the buttons beside the indicators to reorganize how the report is presented to you. Use the Reset to default settings button to restore the default layout of the chart and Apply button to save your settings.
Editing your products
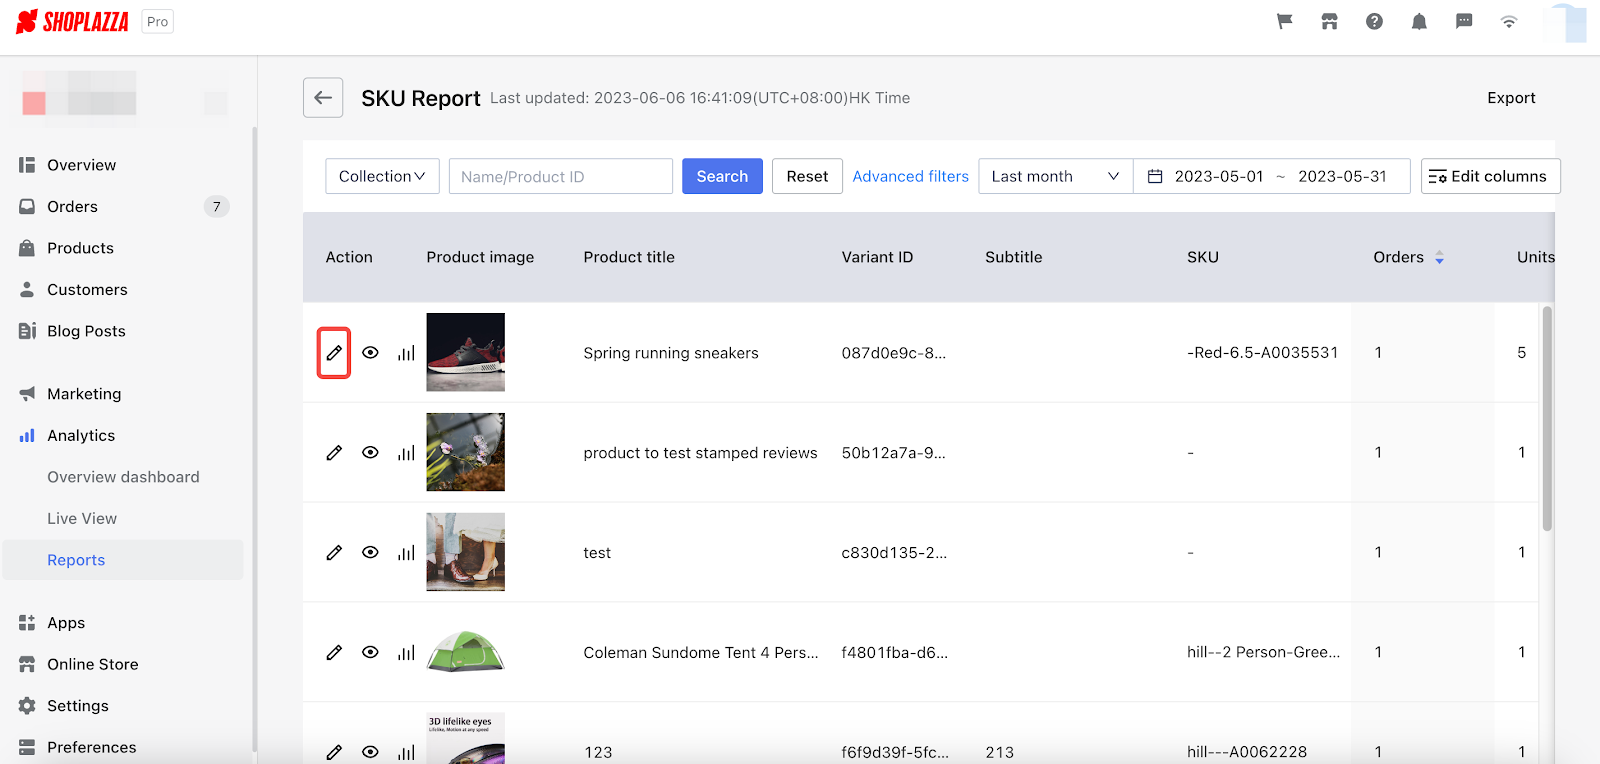
Enhance your product descriptions and create a more engaging shopping experience by updating images and including coupons to attract customers' attention.
You can access the editing page of a product by clicking the pencil icon on the right.
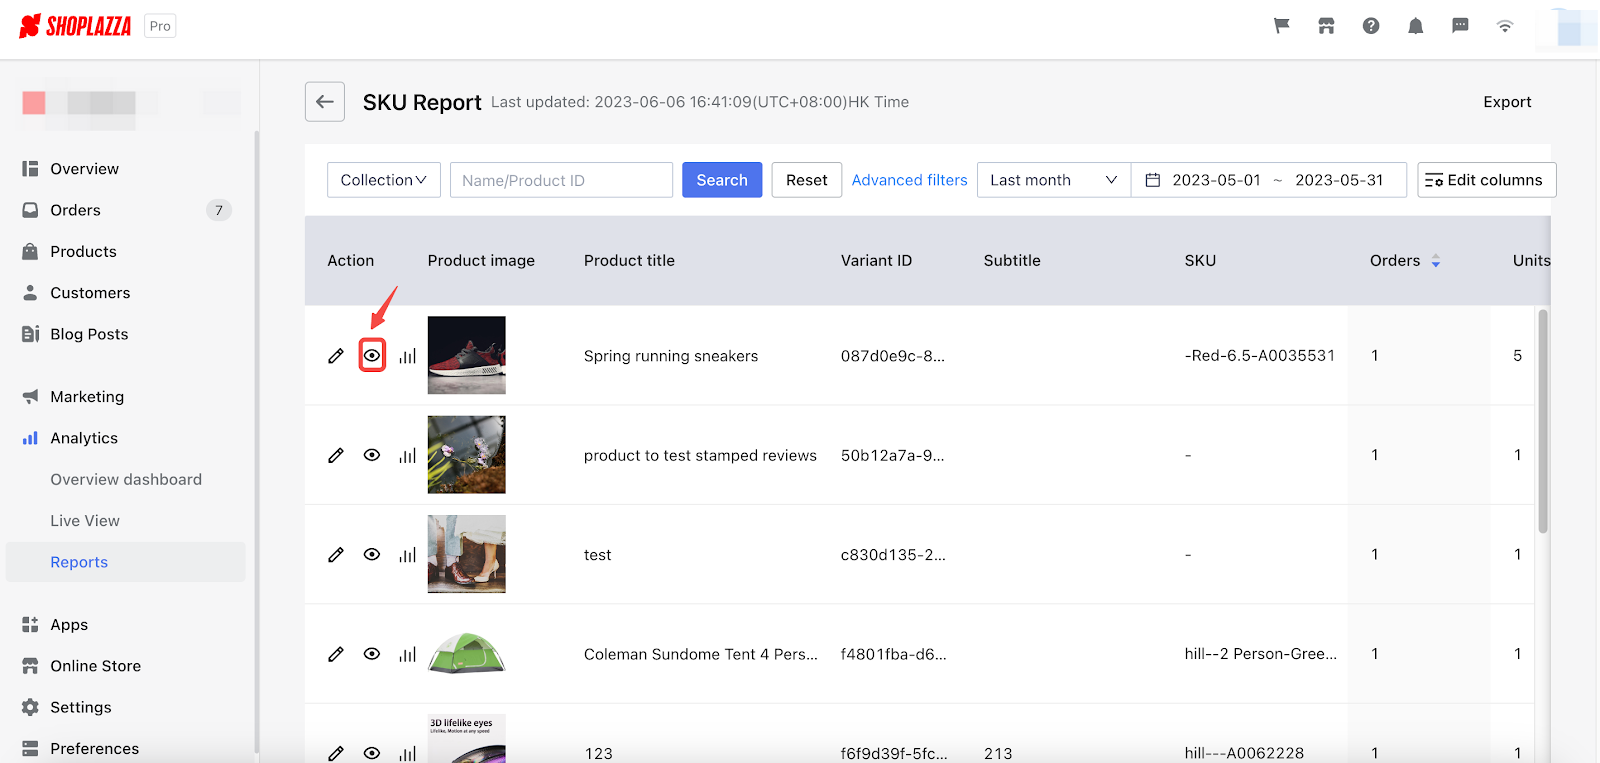
Previewing the product detail page
Once you have analyzed the SKU report and made modifications to the product page, you can easily preview the page by clicking on the eye icon.
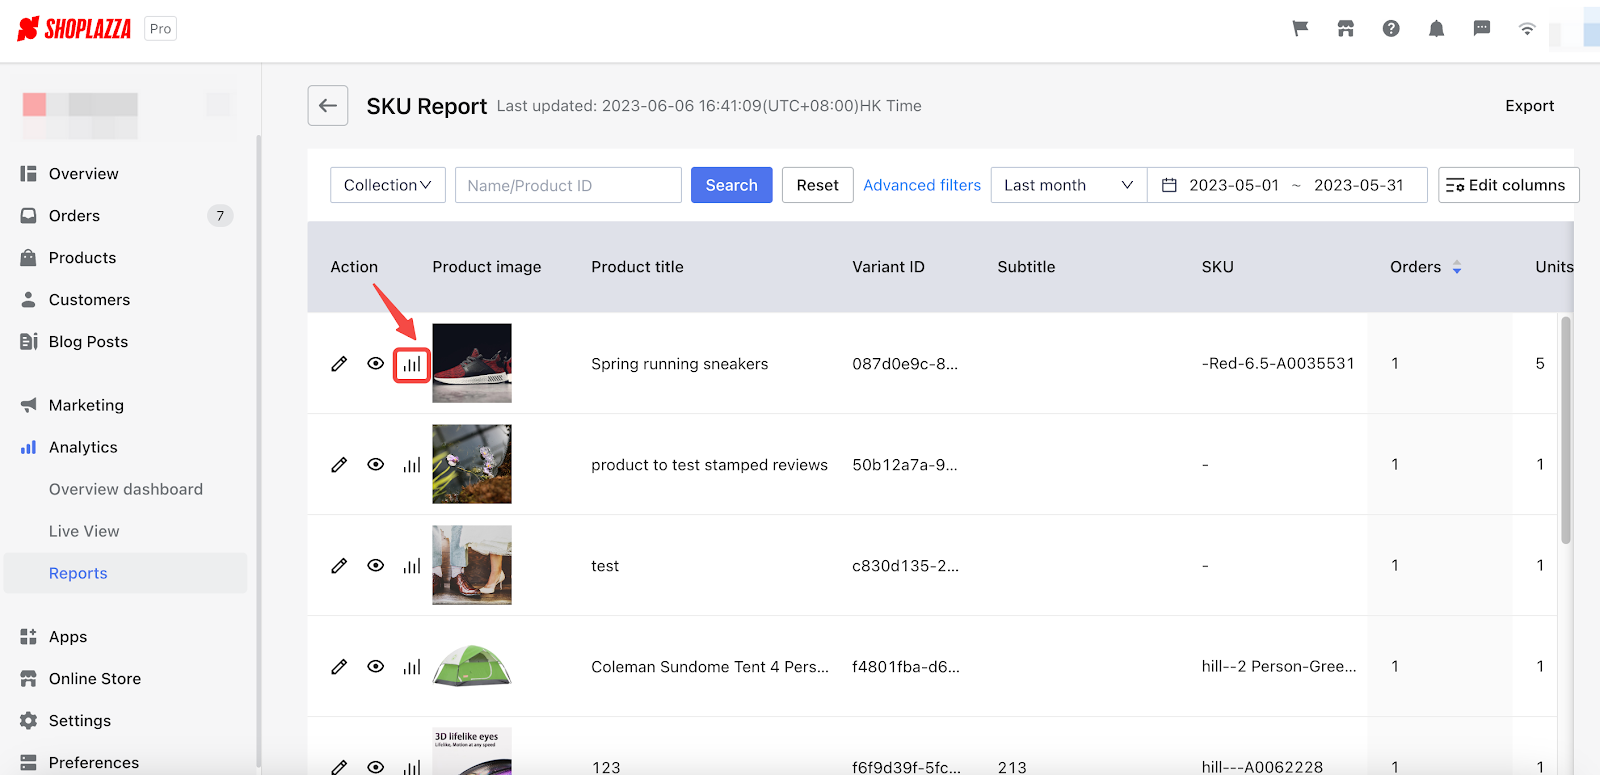
Monitoring data of specific products
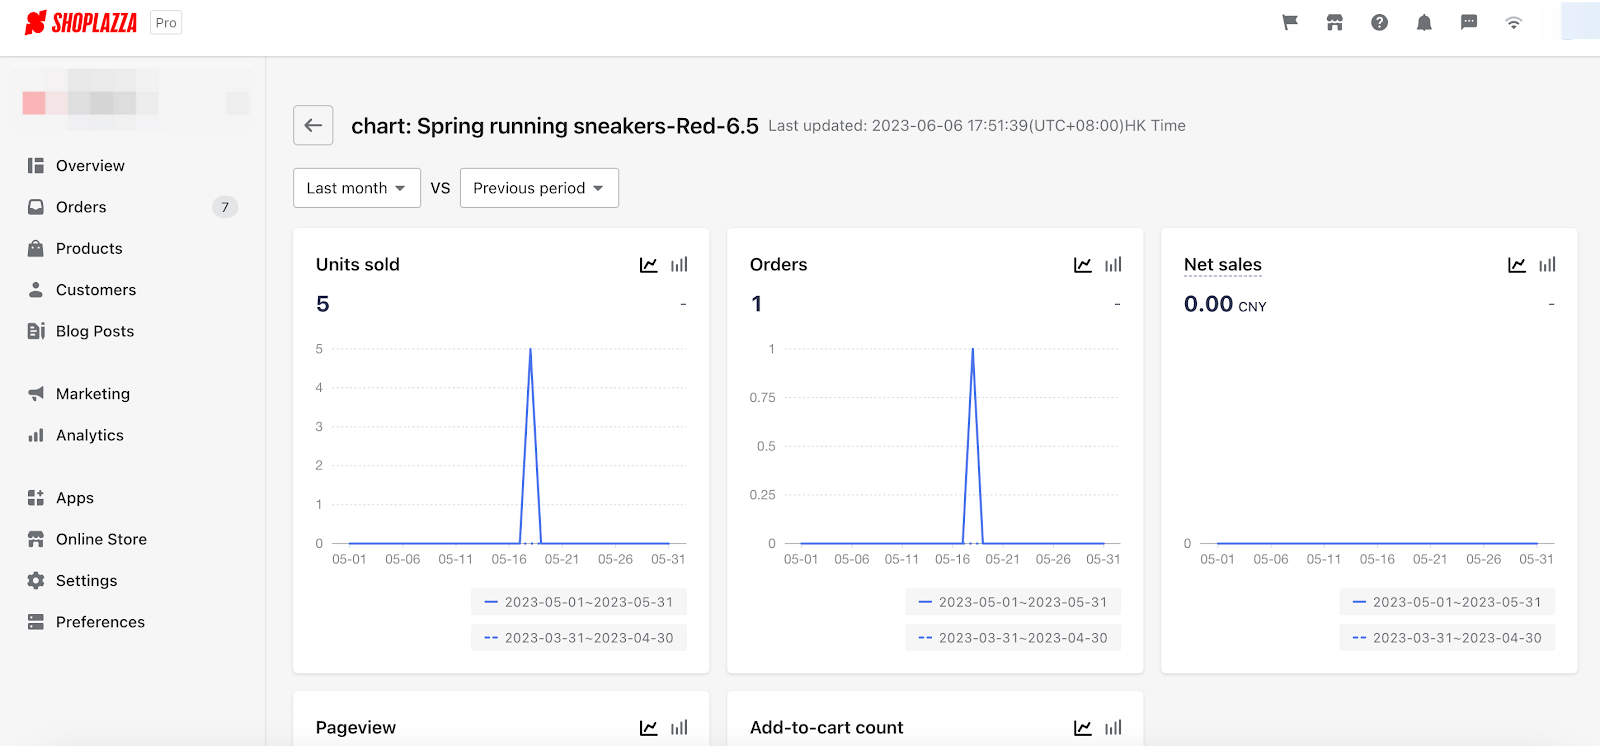
To access the trend analysis page for each product, simply click on the chart icon. This page presents valuable data such as net sales, units sold, orders, and more.
Saving a copy of your SKU report
By exporting your report, you can obtain a comprehensive snapshot of important data and metrics related to that specific page. Additionally, exporting the report allows you to view the report and access the data offline, make adjustments and seamlessly integrate it with other tools for better reporting and decision-making.
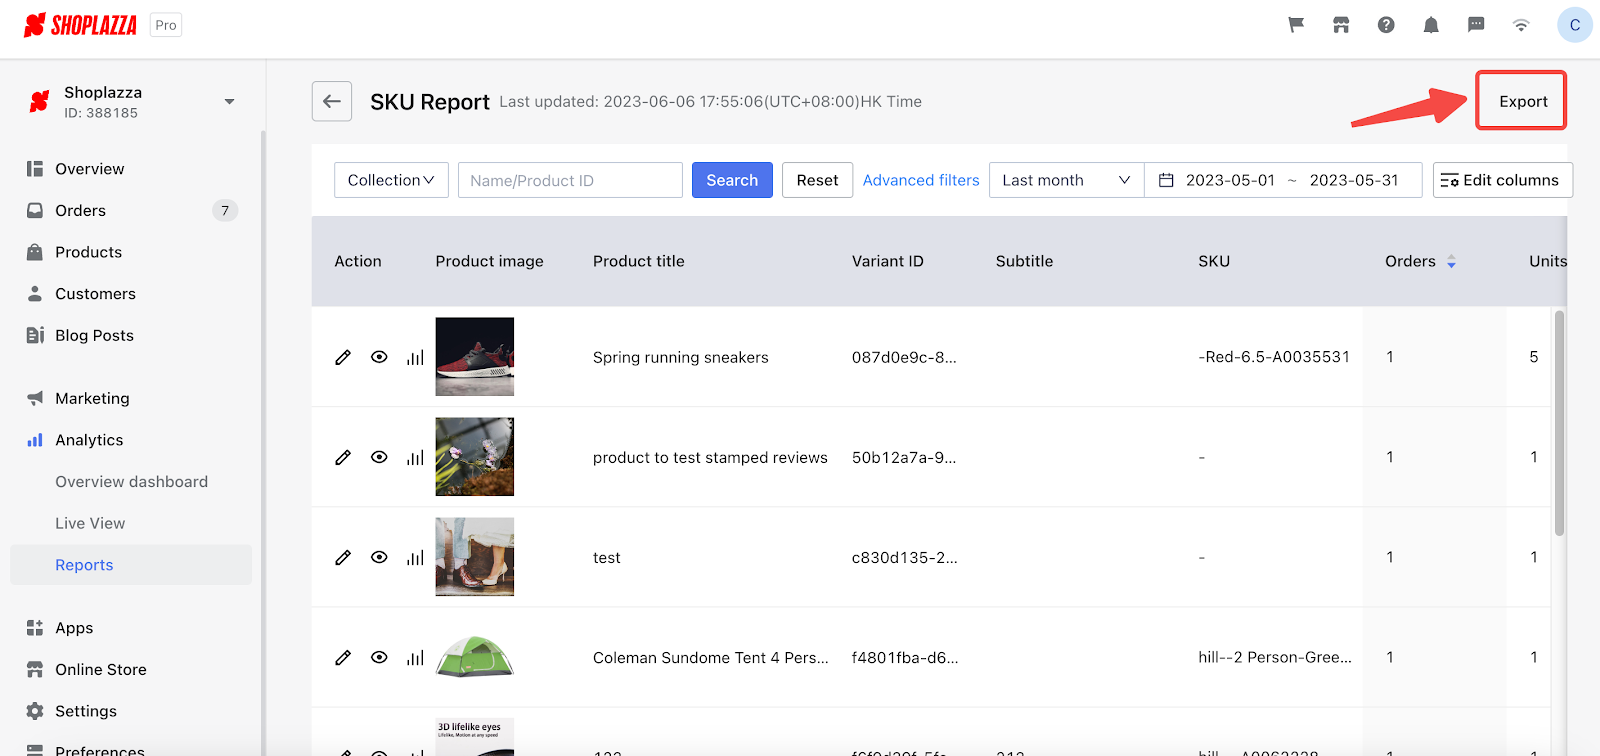
To save a copy of your SKU report, click on the Export button located on the right.
Note
All the headers in the SPU report will be saved, including those folded ones.
The chart below provides a comprehensive overview of each indicator in your product SKU report, helping you understand their respective meanings:
| Indicators | Definitions |
| Product image | The image of the product displayed in your store. |
| Product title | The title or name of your product. |
| Variant ID | The identification code that marks different variants of a product. |
| Subtitle | The subtitle of products. |
| SKU | (stock keeping units) Codes that you can use internally to track your inventory and report on your sales. |
| Orders | The number of orders successfully placed. |
| Units sold | |
| Total selling price (CNY) | Total number of the selling price. |
| Net sales | Total number of sales with discounts excluded. |
| Pageview | Total number of views on the product detail page. |
| Add-to-cart count |
The total count of a specific product that has been added to the shopping cart. Each time a customer selects the "Add to Cart", it increases this count." |
| Proportion of pageview | The ratio of pageviews of one product to pageviews of all products. |
| Proportion of add-to-cart | The ratio of add-to-cart of one product to add-to-cart of all products. |
| SPU | Standard product unit. |
| Add-to-cart rate | The ratio of add-to-cart of a product to the number of visitors of a product detail page. |
| Variant title | The name or the title of the variant of the product. |
| Attribute updated at | The time when the attribute is published or updated. |
SKU related data in Shoplazza Admin provides you with comprehensive sales information of a product. With such a report, it will be much more convenient for you to keep track of your products and variants.


Comments
Please sign in to leave a comment.