
The term SPU (Standard Product Unit) refers to the smallest unit of information gathering or merging for a product or commodity. The SPU report provides various data related to SPUs, which helps you track and analyze the performance of your products. This report gives you valuable insights into metrics such as product views, add-to-cart actions, orders, and refunds specific to each product.
By using the SPU report in your Shoplazza admin, you can gather data on how customers interact with your products throughout the purchasing process. This information allows you to make more informed decisions when it comes to marketing strategies. For example, you can identify which products are most popular or have the highest conversion rates, enabling you to focus your marketing efforts on those items. Additionally, the report can help you identify any issues or trends related to refunds, allowing you to address them promptly and improve overall profitability.
Viewing your SPU report
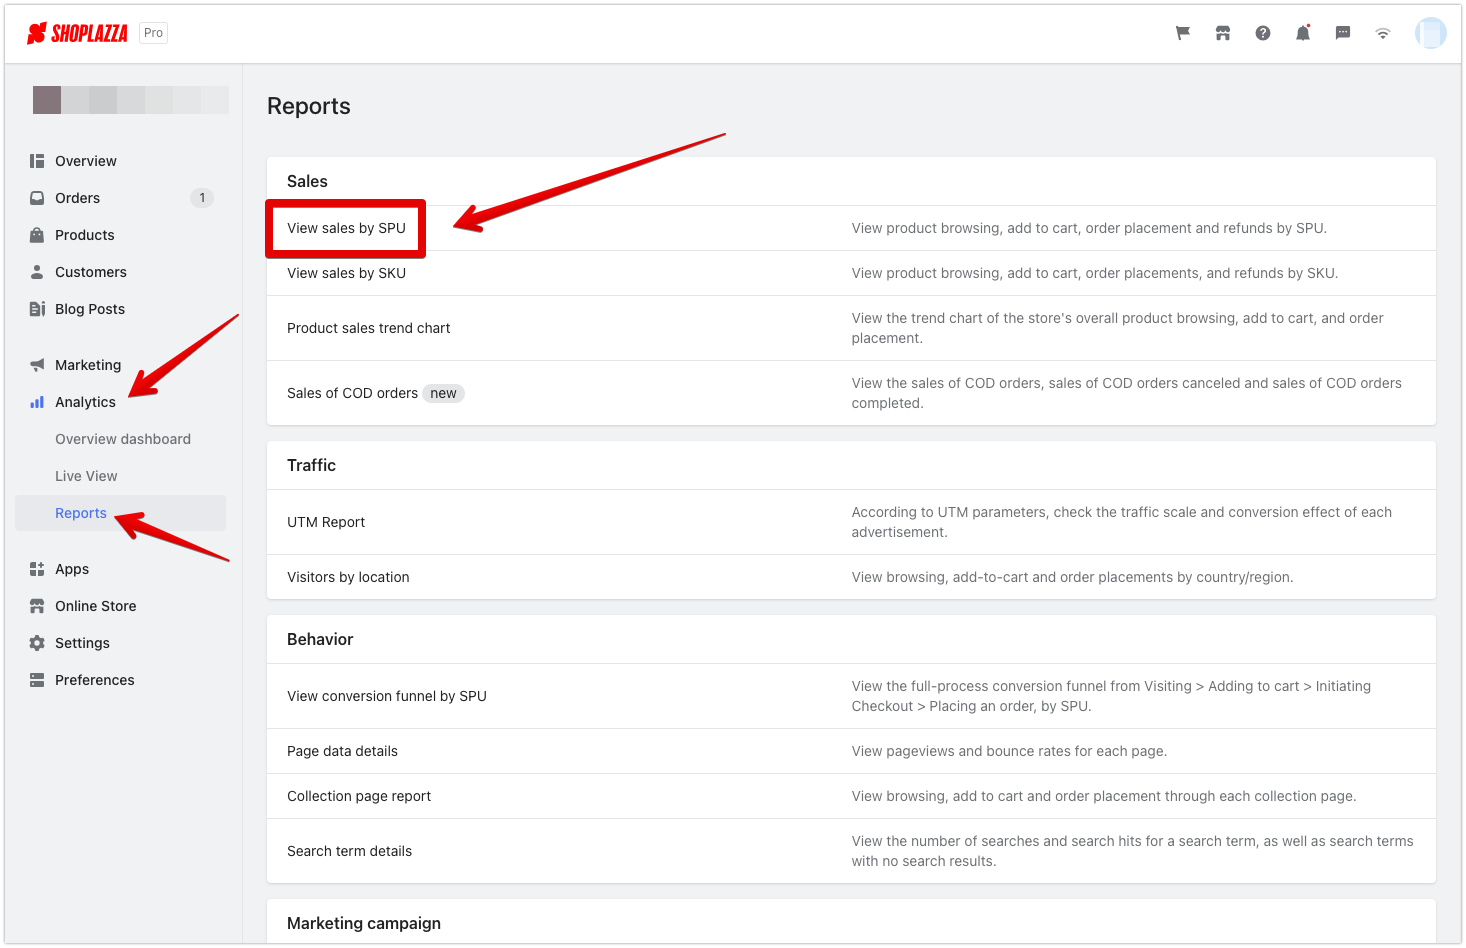
You can access your SPU report by going to your Shoplazza Admin > Analytics > Reports. Under the Sales section, click on the SPU report.
Filtering your report by date
To personalize your report, you can either select the time indicator by clicking on the date column or choose the custom option from the drop-down menu.


Note
By default, your View sales by SPU report will automatically display today's data, starting at 12:00 am.
Filtering by product/collection name
1. To find data for a specific product, simply type the name or ID of the product in the search box. You can also input the collection name to view all the product data in the collection.
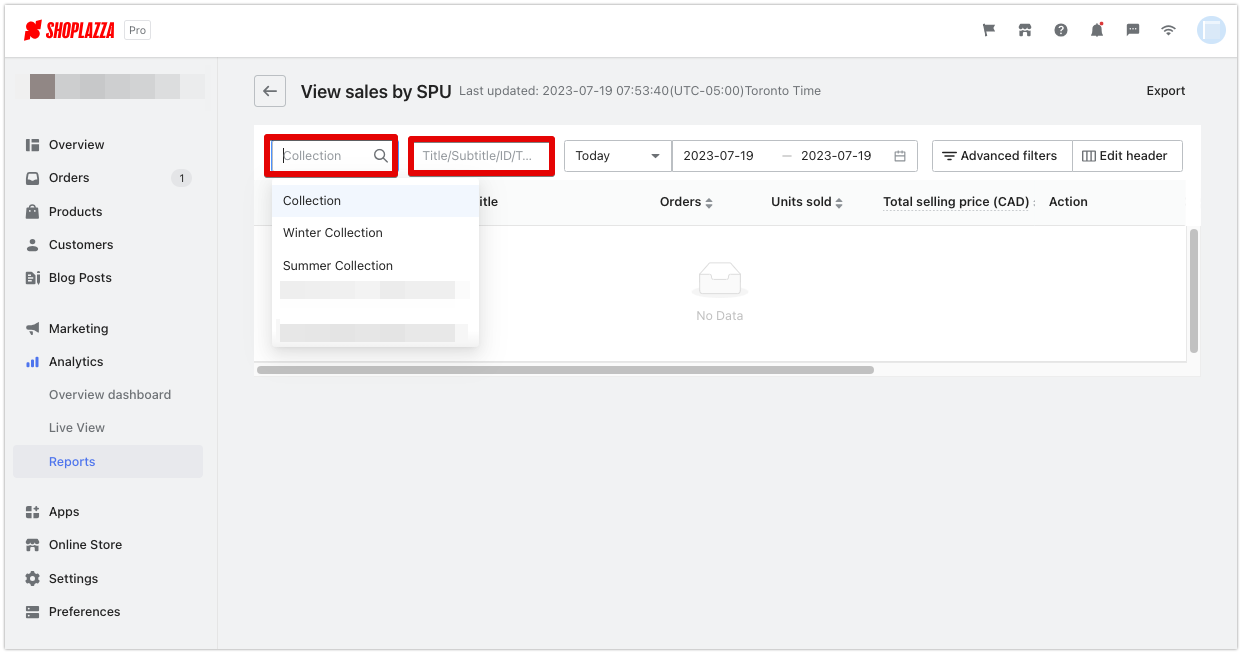
2. To view a specific category of products that meet specific criteria, you can utilize the Advanced filters button to refine the product range.


Note
SPU report only displays products with traffic recorded. For example, new products with no views or sales cannot be displayed in the SPU report.
Sorting your data
To sort your search results in the report, simply click on the arrows next to the headers. You can arrange the data in ascending or descending order. For instance, clicking the arrows next to the "Orders" header and pointing them upward will sort the number of orders in ascending order. Conversely, pointing the arrows downward will arrange the list of orders in descending order.

Editing the column headers
To customize and personalize your SPU report, you have the ability to tailor it according to your preferences. Here's how you can make adjustments:
1. Choose the headers you want to see in the report using the Edit header option.
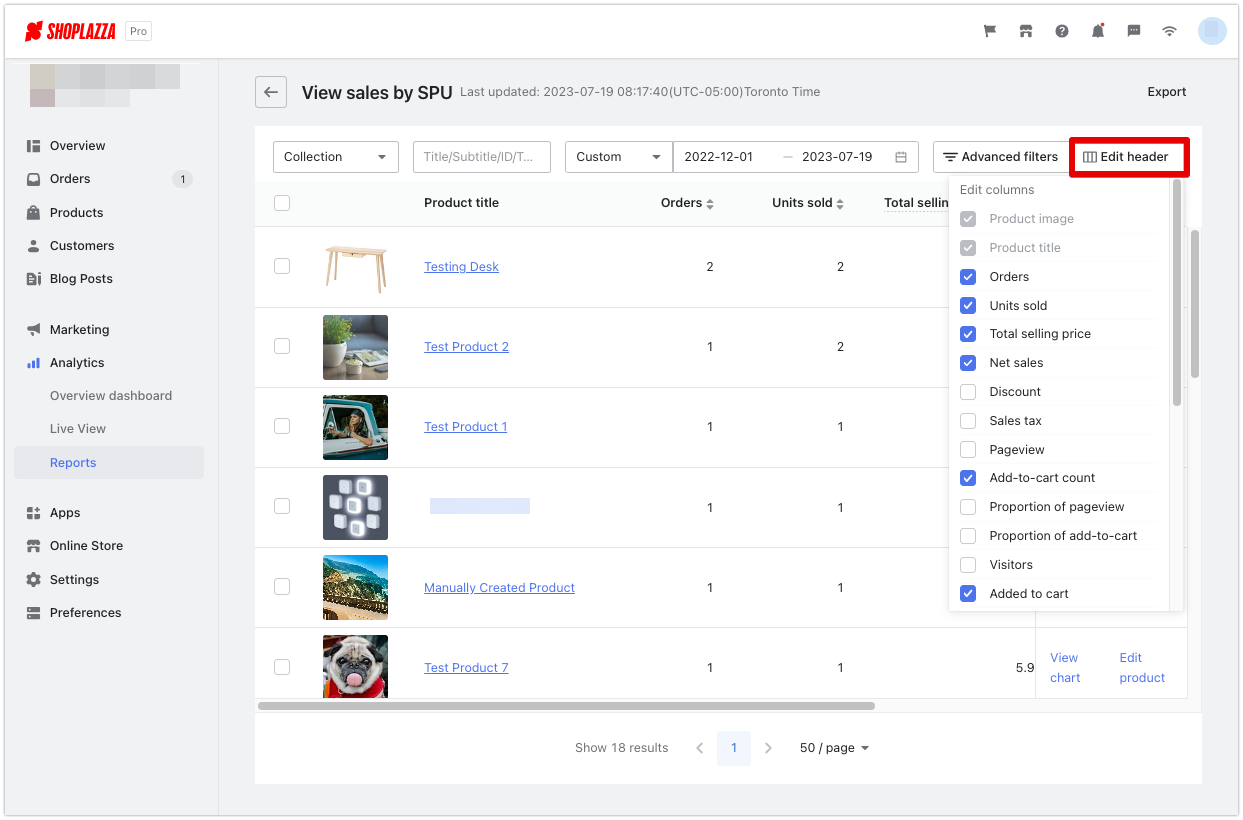
2. Include specific information in the report by checking the corresponding boxes to enable indicators.

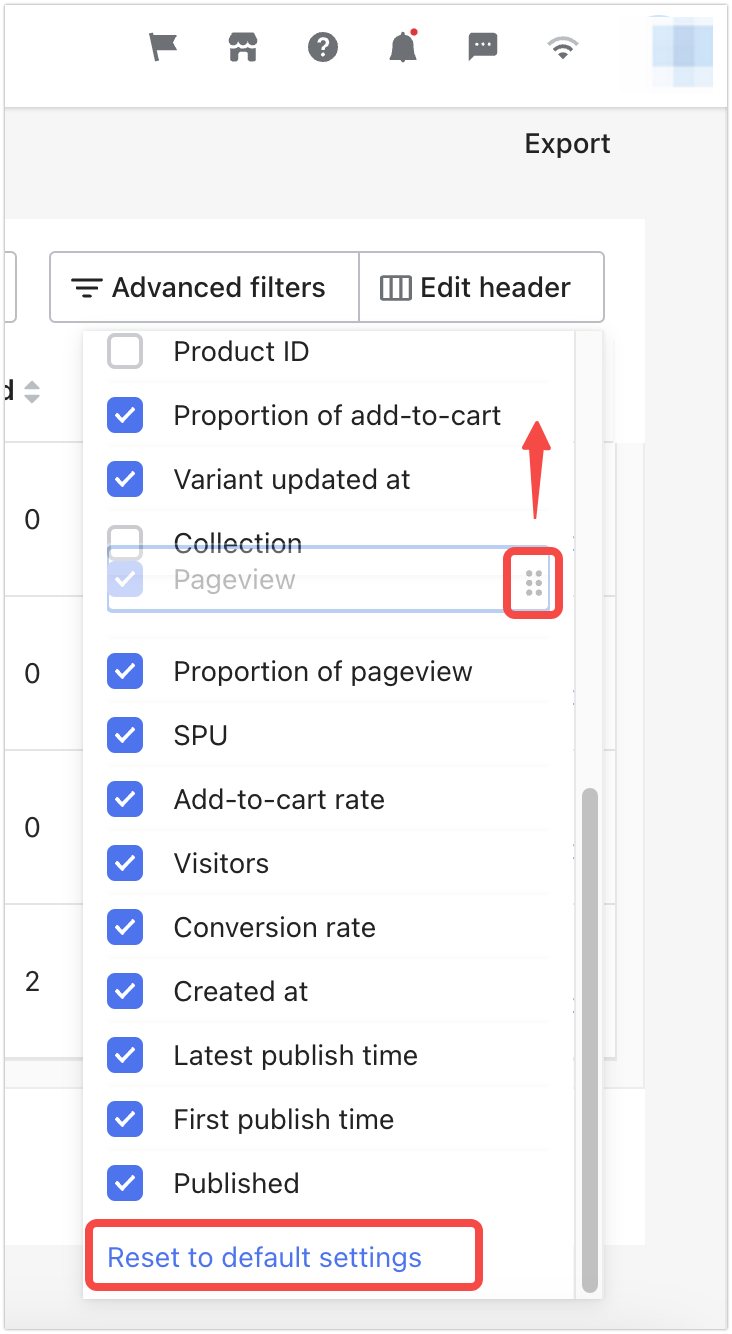
3. Rearrange the presentation of the report by dragging the buttons next to the indicators. If you want to restore the original layout of the chart, simply click the Reset to default settings button.
Updating your products
In addition to viewing your SPU reports, you also have the ability to enhance your product descriptions to create a more engaging shopping experience by updating images, adding more variants, and including coupons to attract customers' attention.
You can access the editing page of a product by using the Edit product button on the right.

Monitoring data of specific products
To access the trend analysis page for each product, simply use the View chart option. This page presents valuable data such as product conversion funnels, units sold, orders, and more.


Saving a copy of your SPU report
By exporting your report, you can obtain a comprehensive snapshot of important data and metrics related to that specific page. Additionally, exporting the report allows you to view the report and access the data offline, make adjustments, and seamlessly integrate it with other tools for better reporting and decision-making.
To save a copy of your SPU report, click on the Export button located on the right.

Note
Please note that when viewing the SPU report, certain headers may be hidden or minimized. It's important to remember that all the headers, including the ones that are currently hidden, will also be displayed in the exported file.
The chart below provides a comprehensive overview of each indicator in your product SPU report, helping you understand their respective meanings:
| Indicator | Definition |
| Product image | This refers to the image of the product that is displayed in your store. |
| Product title | This is the title or name given to your product. |
| Product ID | This is the unique identification assigned to your product. |
| Subtitle | This is an optional subtitle or additional name for your product. |
| Orders | This indicates the total number of successfully placed orders. |
| Units sold | This represents the total quantity of products sold across all orders. |
| Total selling price | This is the cumulative selling price of the product. |
| Net sales | This is the total sales revenue generated after excluding any discounts. |
| Pageview | This shows the overall number of times the product detail page has been viewed. |
| Add-to-cart count | This denotes the total count of a specific product that has been added to the shopping cart. |
| Proportion of pageview | This represents the ratio of pageviews for a particular product to the pageviews of all products. |
| Proportion of add-to-cart | This indicates the ratio of add-to-cart actions for a specific product compared to all products. |
| SPU | SPU stands for Standard Product Unit, which refers to the smallest unit of information gathering or merging for a product or commodity. |
| Add-to-cart rate | This represents the percentage of visitors who added the product to their cart out of the total number of visitors to the product detail page. |
| Visitors | This denotes the total number of individuals who have visited the product detail page. |
| Added to cart | This indicates the number of customers who have added the product to their cart. |
| Conversion rate | This represents the percentage of visitors who made a purchase out of the total number of visitors. |
| Created at | This indicates the time when the product was initially created. |
| Latest publish time | This represents the most recent time the product was published in the store. |
| Variant publish time | This shows the publish time of a specific variant of the product. |
| Published | This indicates whether the product is currently published or not. |
In conclusion, the SPU report empowers you to customize and personalize your data display according to your preferences. By selecting specific headers, enabling indicators, and arranging the report to your liking, you can create a comprehensive and tailored view of your information.


Comments
Please sign in to leave a comment.