
Managing large sets of data is simplified with Shoplazza's custom reporting capabilities. You can easily create and view custom reports tailored to your needs. For this guide, we'll walk you through creating a "Sales Daily - Affiliates" report. If you're not familiar with what "Affiliates" mean, it's simply a way to track daily sales or site visits that come via partners or third-party sites.
Creating a custom report
1. From your Shoplazza admin > Analytics > Reports, scroll down to the Custom section and click Create custom report.

2. Name your report "Sales Daily-Affiliates" and choose the relevant criteria and dimensions. In this context, "Dimensions" are specific attributes or characteristics that help you break down your data. For instance, "Product title" or "Device type" could be dimensions.
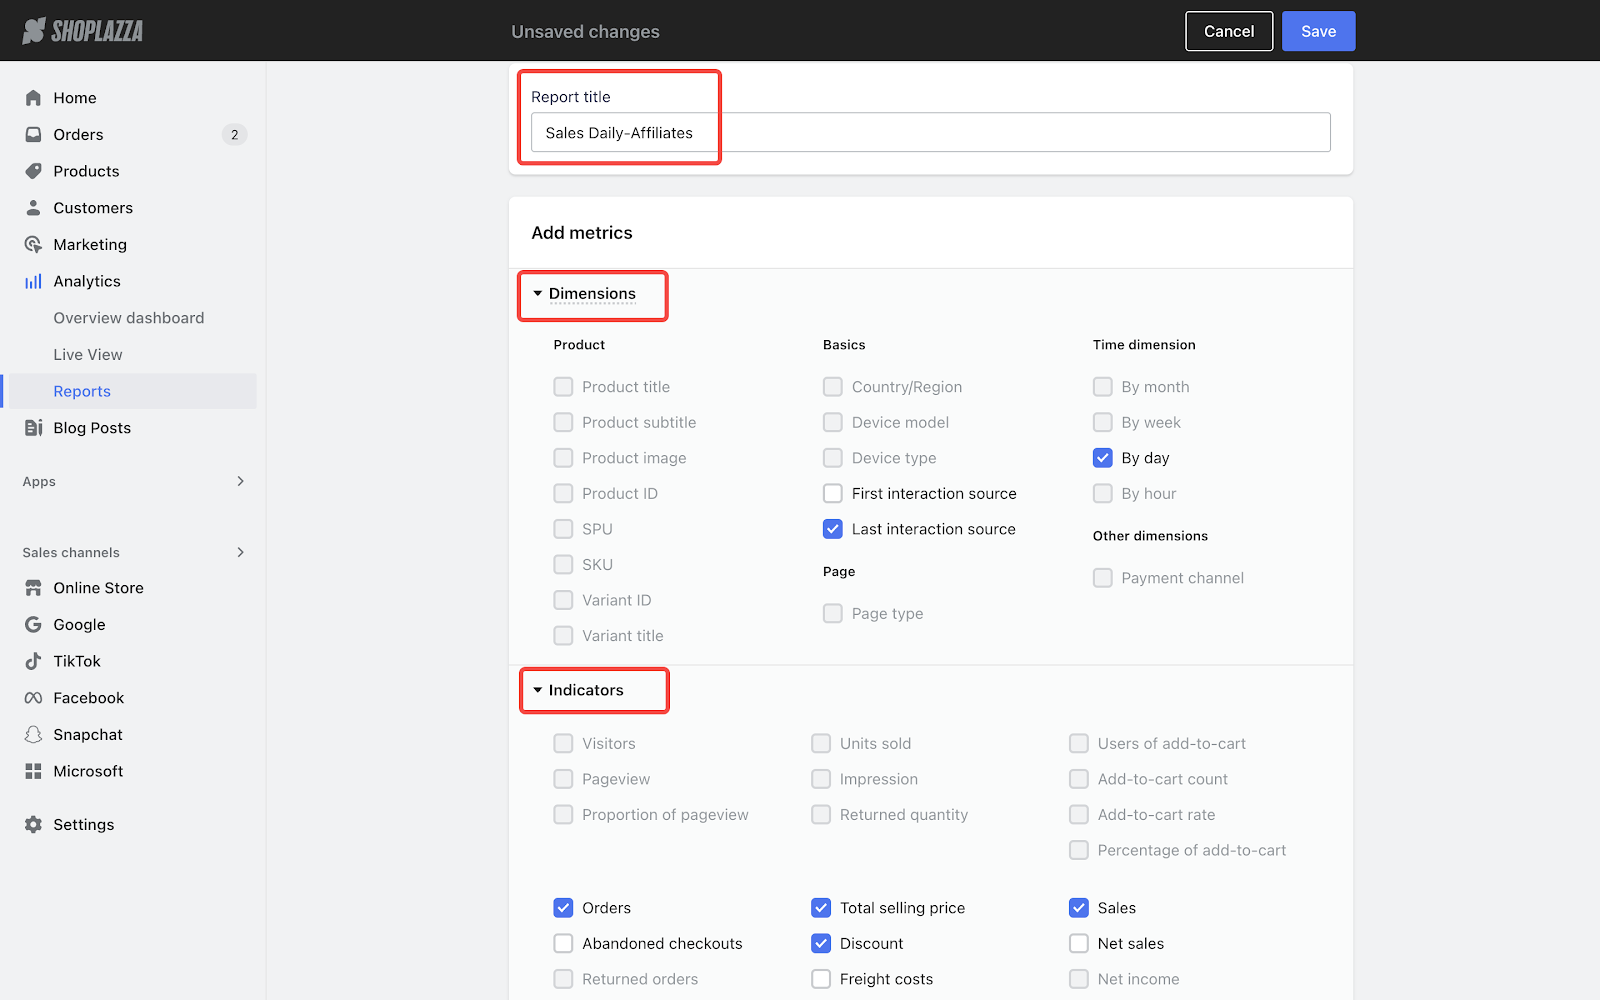
Note
- Some dimensions can not be selected at the same time.
- Some indicators are not applicable for specific dimensions.
3. Scroll down to select "Affiliate" in the dropdown as the filter and click Save to complete the process.


Viewing your custom report
Simply navigate to your Shoplazza admin Analytics Reports. Scroll down to find your report in the Custom section. Here, you also have options to duplicate, rename, or delete the report.

Features of your custom report
Customizable time period
By default, the page displays the data of Today (from 0:00 to the time of entering the page) based on the time zone of the store.
If you want to look at data from different periods, you have that option in the dropdown menu.

Managing your filters
To adjust the scope of your data, click Manage filters.


Updating your metrics
To customize the metrics shown, click Edit metrics.


Exporting your data
Click Export to download an Excel file containing the filtered data on the page.

Note
If you have allowed "Include tax in price" for products, the sales tax of the order will be included in the total sales price, and the item "sales tax" will no longer be calculated.
Indicators of the report
Dimensions| Section | Indicator | Definition |
| Product | Product title | Name of the product. |
| Product subtitle | Subtitle of the product. | |
| Product image | Pictures of the product. | |
| Product ID | The unique identifier assigned to a specific product. | |
| SPU | The standardized measurement or quantity used to represent a product. | |
| SKU | The unique identifier used in inventory management to track and manage individual items or products. | |
| Variant ID | ID of the variant of the product. | |
| Variant title | Name of the variant of the product. | |
| Basics | Country/Region | A visitor's country or region. |
| Device model | The model of a visitor's device. E.g. Samsung, MacBook. | |
| Device type | The type of a visitor's device. E.g. computer, mobile phone. | |
| First interaction source | The source from which a visitor navigates to your store for the first time in the last 30 days. | |
| Last interaction source | The source from which a visitor navigates to your store for the last time in the last 30 days. | |
| Page | Page type | Type of the visited page. E.g. blog, collection. |
| Time dimension | By month | The data is collected by month. |
| By week | The data is collected by week. | |
| By day | The data is collected by day. | |
| By hour | The data is collected by hour. | |
| Other dimensions | Payment channel | The channel through which a visitor complete the checkout. |
Indicators
| Indicator | Definition |
| Visitors | Total number of users visiting the site. |
| Pageview | The number of times the page is viewed. |
| Proportion of pageview | The number of unique users who click on a certain product page, divided by the number of those who click on all product pages. |
| Units sold | The number of products included in the completed orders. |
| Impression |
The number of times a product is viewed on pages other than its details page. If you haven't selected options in the "Product" dimension above, the indicator represents the number of times all products are viewed on pages other than their details pages. |
| Returned quantity | The number of returned products. |
| Users of add-to-cart | The number of unique users who add 1 or more items to the shopping cart. |
| Add-to-cart count | The number of items added to the shopping cart. |
| Add-to-cart rate | Users of add-to-cart divided by Visitors. |
| Percentage of add-to-cart | The number of a specific product added to the shopping cart, divided by the number of all products added to the shopping cart. |
| Orders | The number of completed orders. |
| Abandoned checkouts | The number of uncompleted orders. |
| Returned orders | The number of successfully refunded orders. |
| Conversion rate | The percentage of website visitors who complete a purchase. |
| Total selling price | The sum of the selling price of the items in orders. |
| Discount | The total amount of price deduction due to discounts. |
| Freight costs | The sum of the shipping fee of completed orders. |
| Sales tax | The sum of sales tax of completed orders. |
| Refund | The total amount of successful refund (calculated based on the time when refund is completed). |
| Sales | Total selling price minus Discount plus Freight costs and sales tax. |
| Net sales | Total selling price minus Discount. |
| Net income | Total selling price minus Discount and Refund. |
| Net amount received |
|
Note
- Orders placed using cash-on-delivery are factored into the metrics, while gift card orders are excluded (except for "Net amount recieved").
- The number of multi-day users is the total of the number of daily users.


Comments
Please sign in to leave a comment.