
I. What Problem Does This Feature Solve?
When running ads across multiple channels, the same order may involve visits and touchpoints from multiple advertising channels. As a result, you may encounter the following challenges:
- Difficulty determining the source of an order: For example, a customer may first visit your store through an ad but leave without placing an order. Several days later, they may search for your store name and return to complete the purchase, making it difficult to determine which channel should be credited for the order.
- Differences in reporting across advertising platforms: Meta, Google, TikTok, and other advertising platforms use their own attribution rules to measure conversions. The same order may therefore be attributed to multiple platforms, causing the total order value reported across platforms to exceed the store’s actual sales.
- Difficulty evaluating the actual contribution of each channel: Without a unified attribution methodology, it can be difficult to accurately understand how different channels contribute to order conversions.
Example: Suppose a store generates a $200 order, and the customer visited the store through Meta, Google, and TikTok before completing the purchase. Because each platform uses its own attribution rules and reporting methodology, the same order may be attributed to each platform separately in their advertising conversion data:
| Platform | Platform Reporting | Attributed Amount |
| Meta | The order is attributed to Meta | $200 |
| The order is attributed to Google | $200 | |
| TikTok | The order is attributed to TikTok | $200 |
| Total | $600 |
Attribution Analysis uses actual store orders as the basis for analysis and applies a unified attribution method to all channels that generated visits within the 30 days prior to the order. Each order is counted only once, and the order is attributed to the relevant channels based on the attribution model you select. This helps you analyze each channel’s contribution to order conversions more accurately.
Specifically, Attribution Analysis addresses the following issues:
| Before | Now |
| If the customer’s final step is to enter the URL directly, return from the payment page, or modify the order in the backend, the order may be recorded as a Direct visit, making it difficult to determine the source of previous visits. | The system combines the order with the customer’s previous visit records and traces back to identify relevant traffic sources. |
| Ad click parameters may be lost after passing through intermediate redirects, causing the order to be attributed to another channel. | You can review the intermediate visit records through order attribution analysis and further verify the relevant information. |
| Only partial visit records could be viewed for an order, making it difficult to understand the complete customer journey. | The system records visit activity from the 30 days before the order, allowing you to view the complete visit path. |
| Only one attribution method was supported, making it difficult to analyze channel contributions from different perspectives. | Five attribution models are available, allowing you to analyze channel attribution from different perspectives. |
Ⅱ. Feature Entry and Page Overview
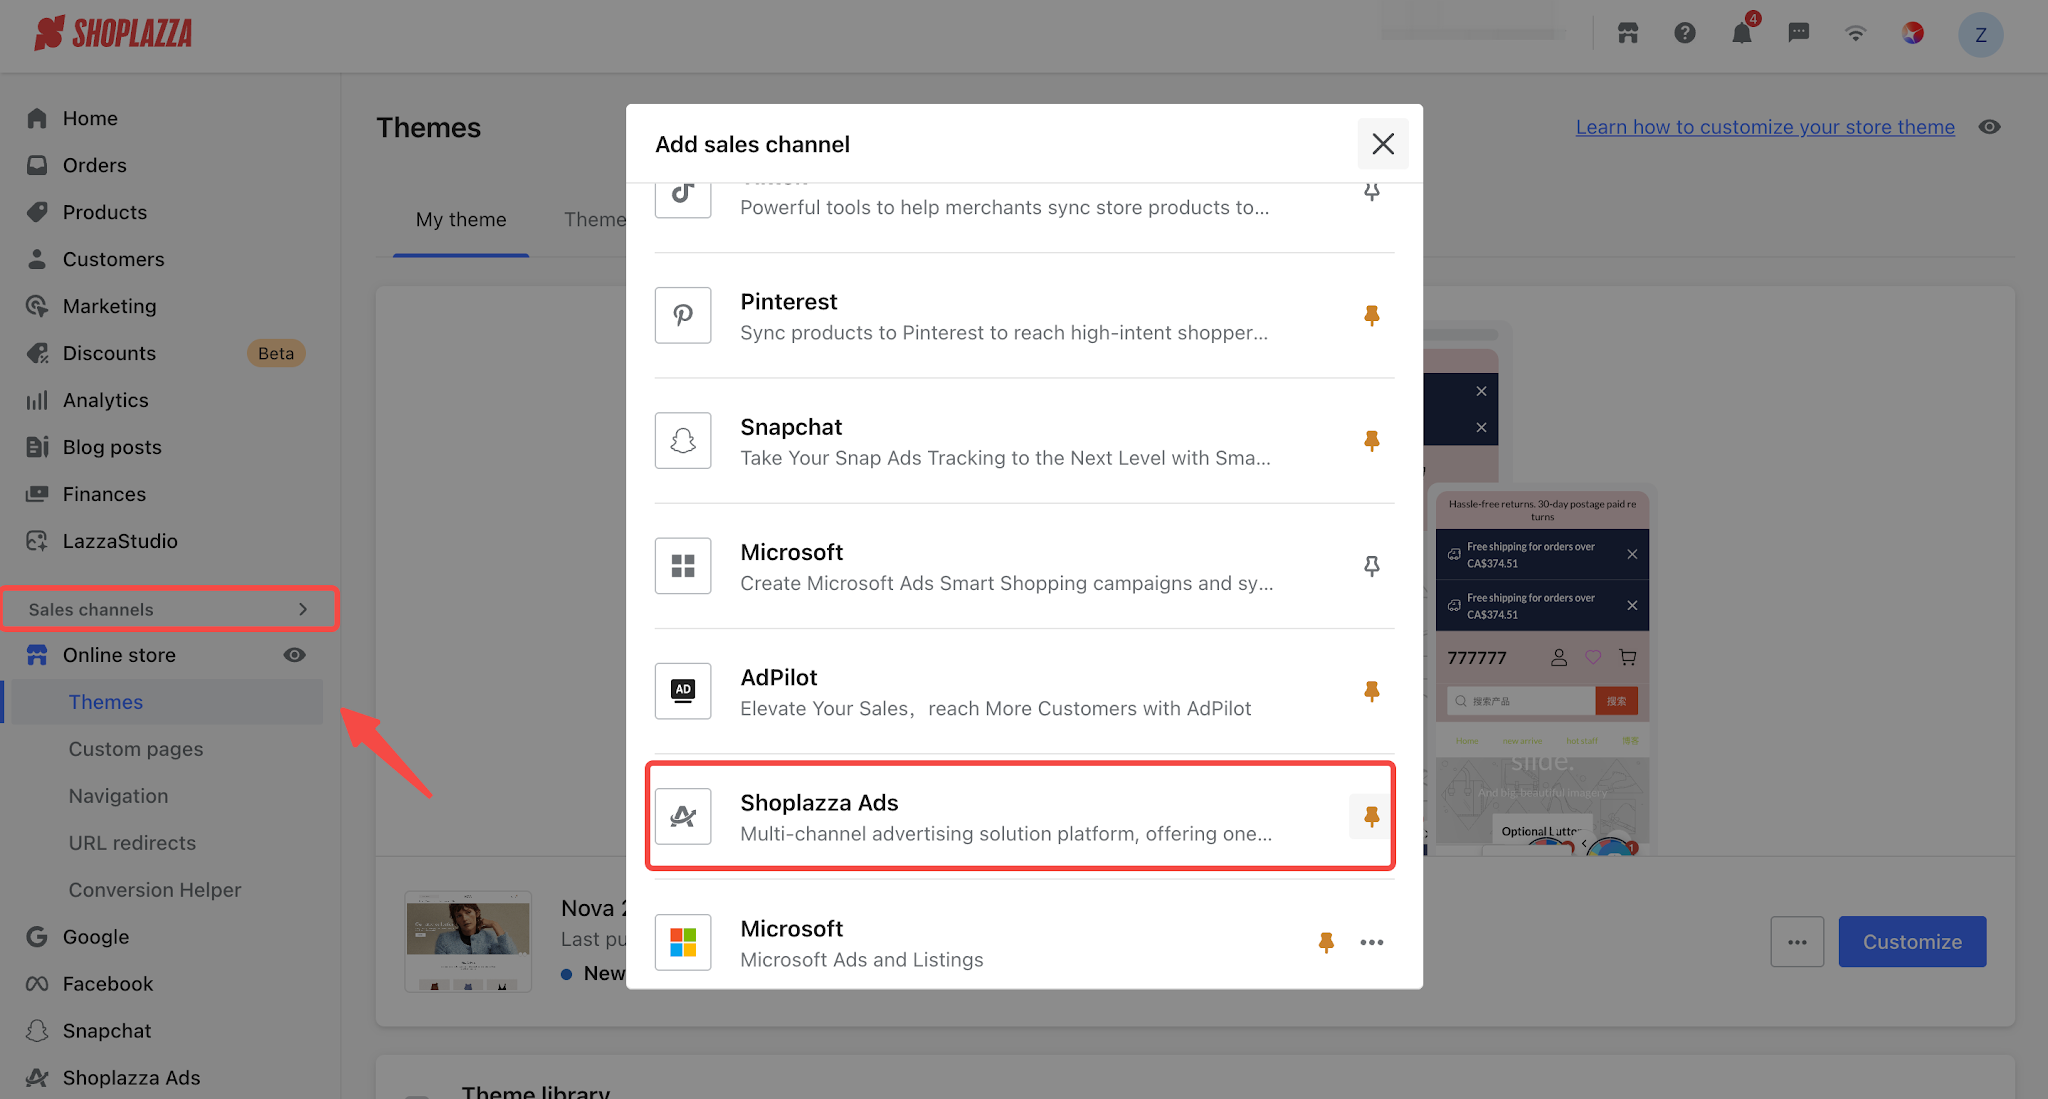
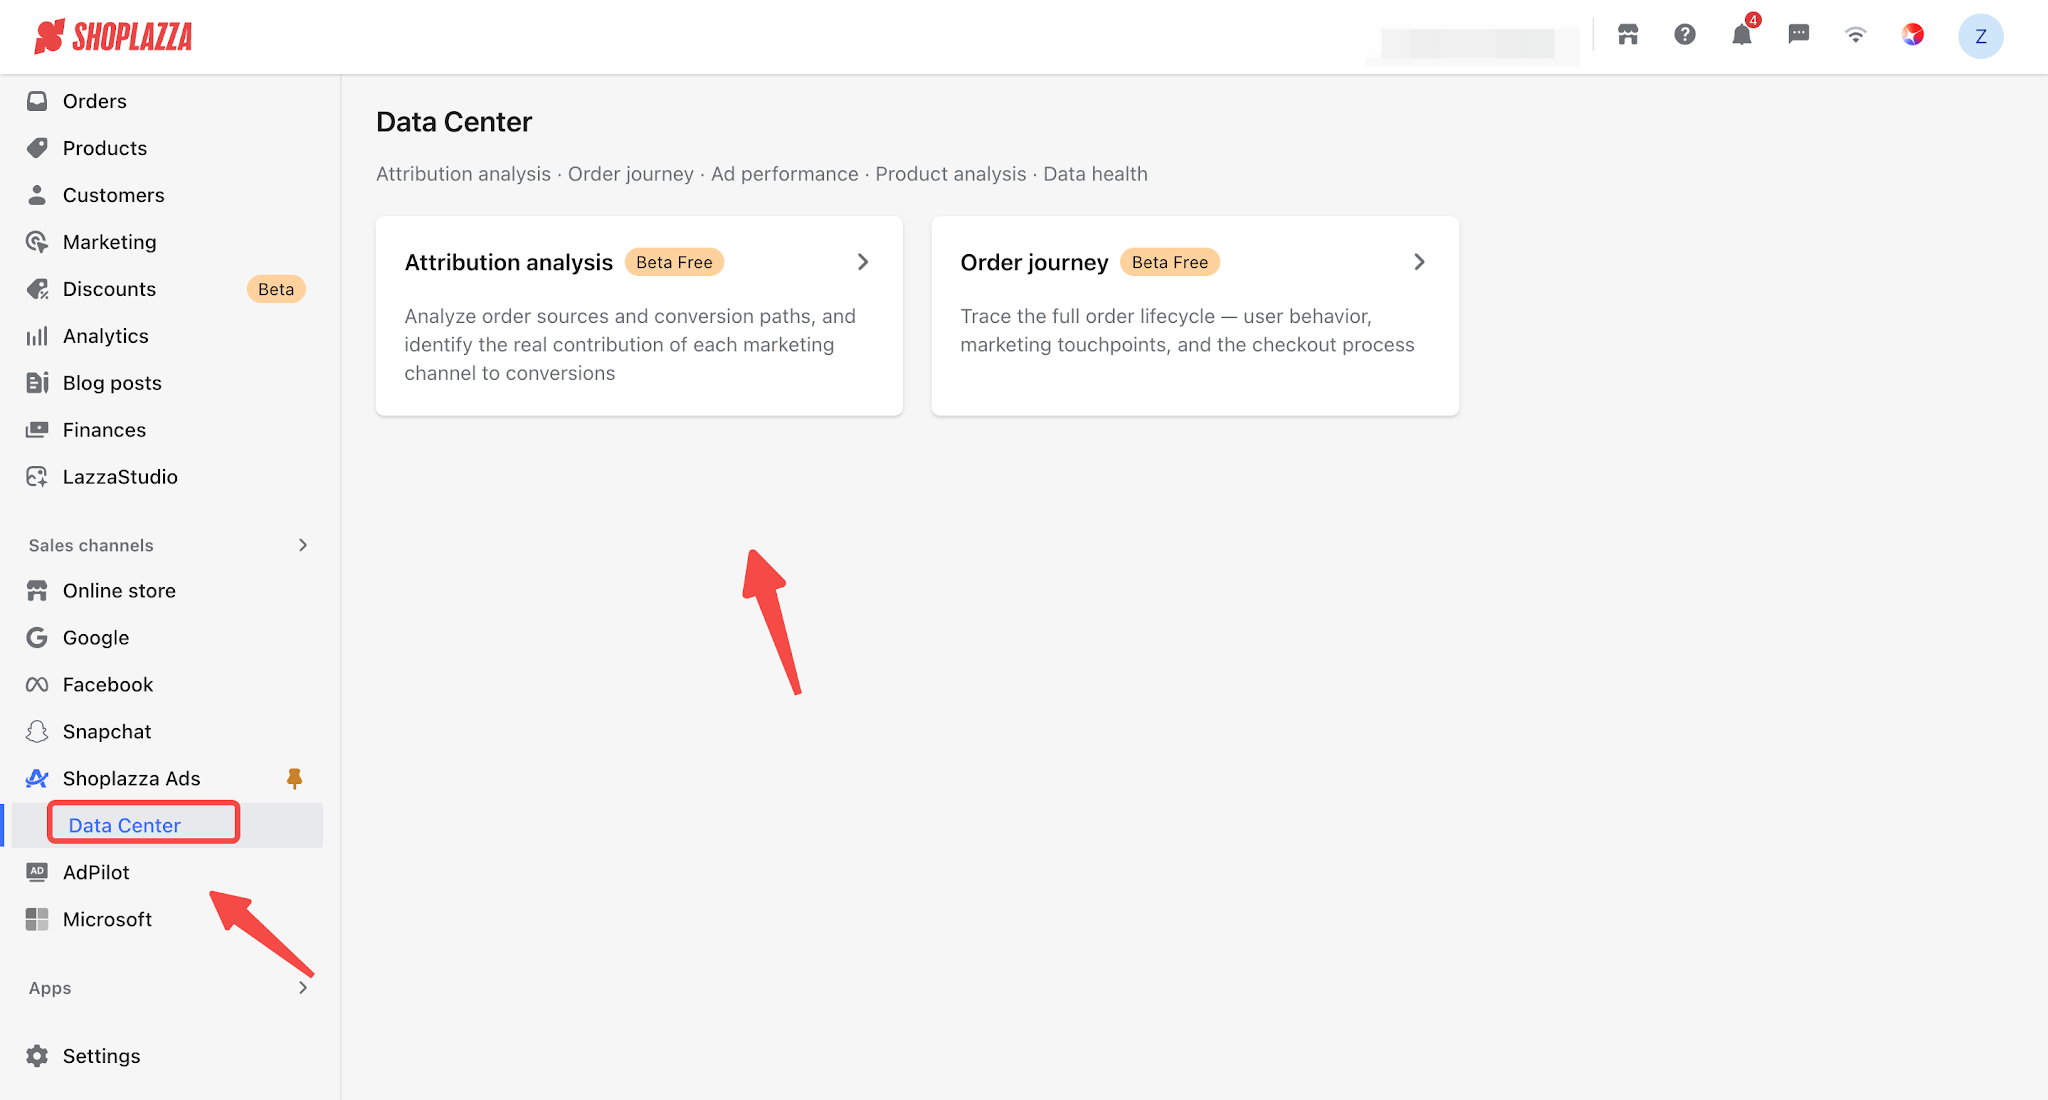
- Log in to your Shoplazza admin panel > Sales Channels > click Shoplazza Ads > enter the Data Center > select Attribution Analysis.
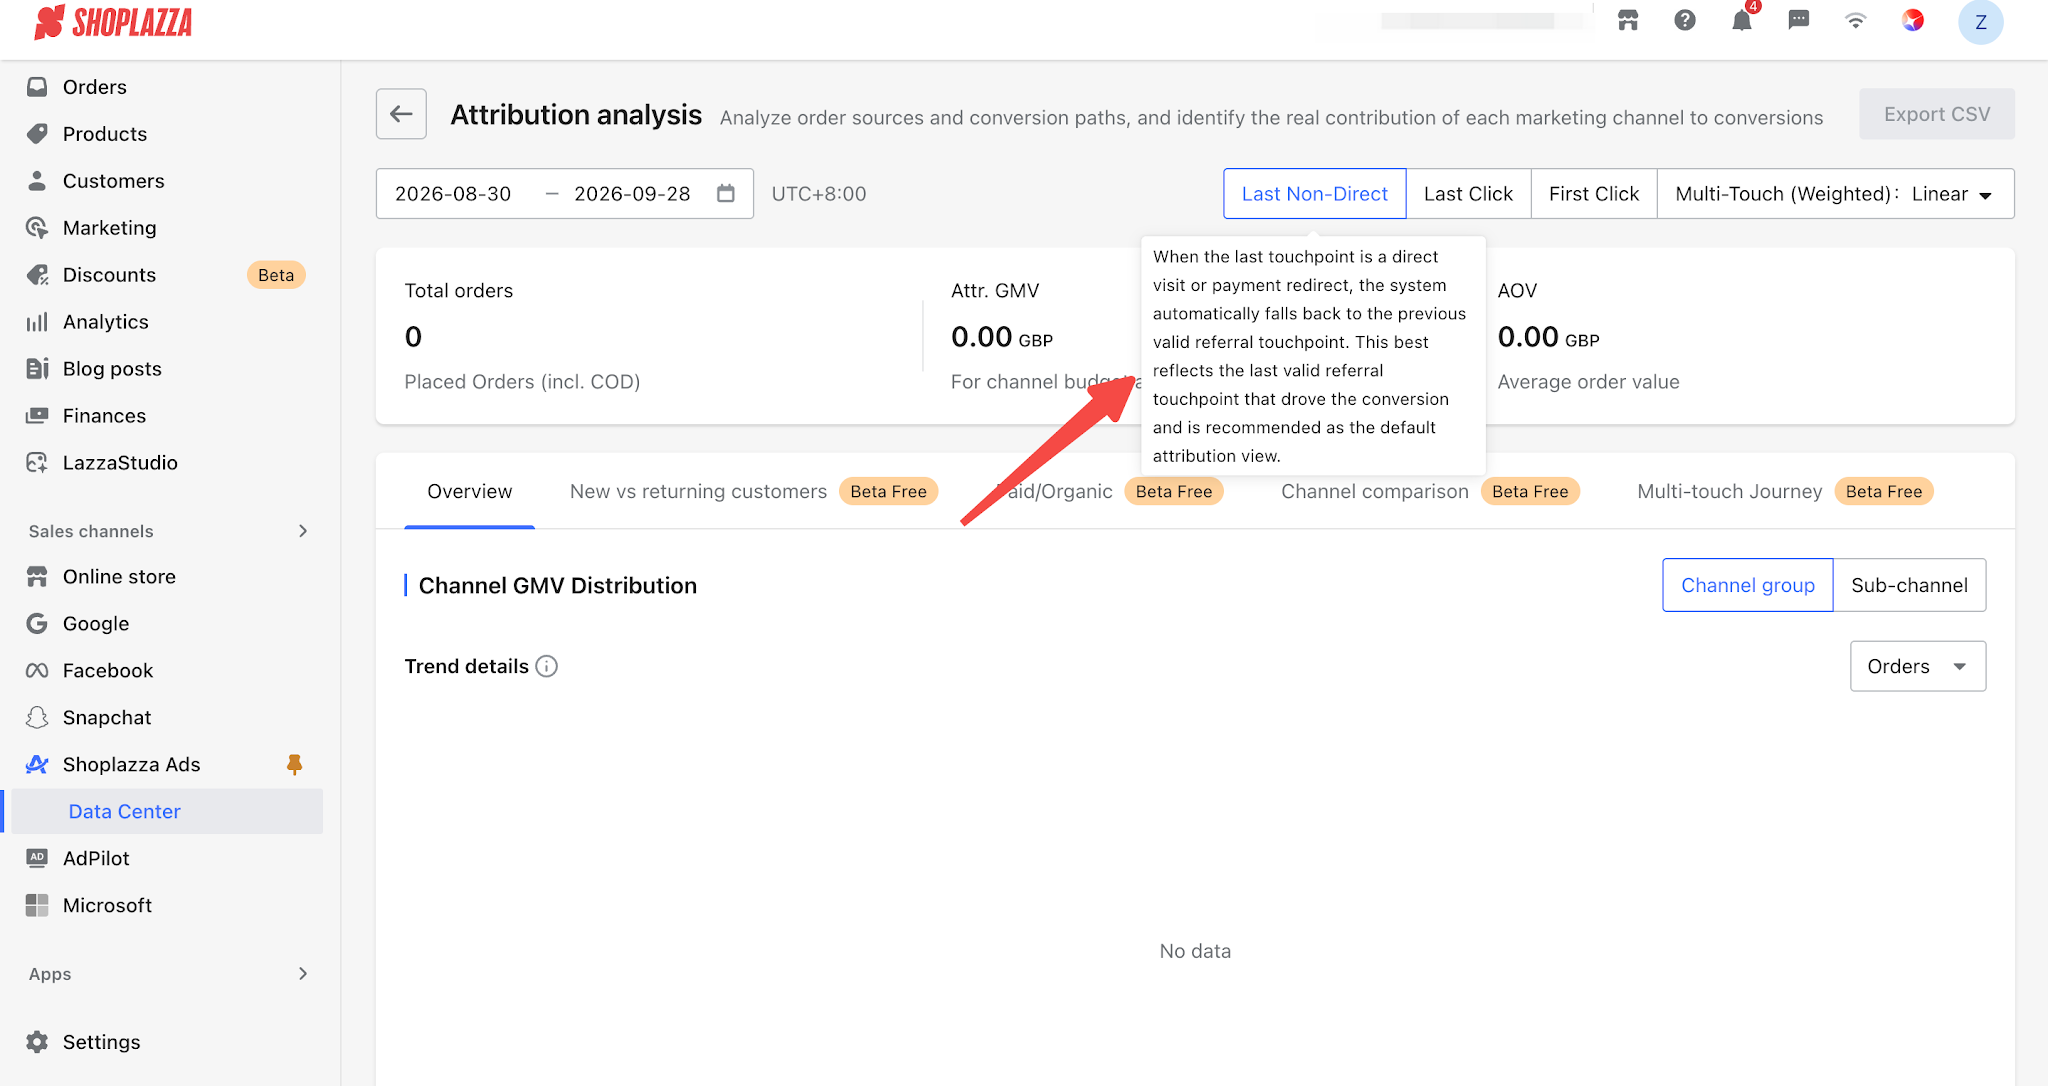
1. On the Attribution Analysis page, you can filter by a date range (up to 30 days at a time, based on the store’s time zone) and switch between five attribution models. Hover over a model button to view its description. For details, see Section 4.
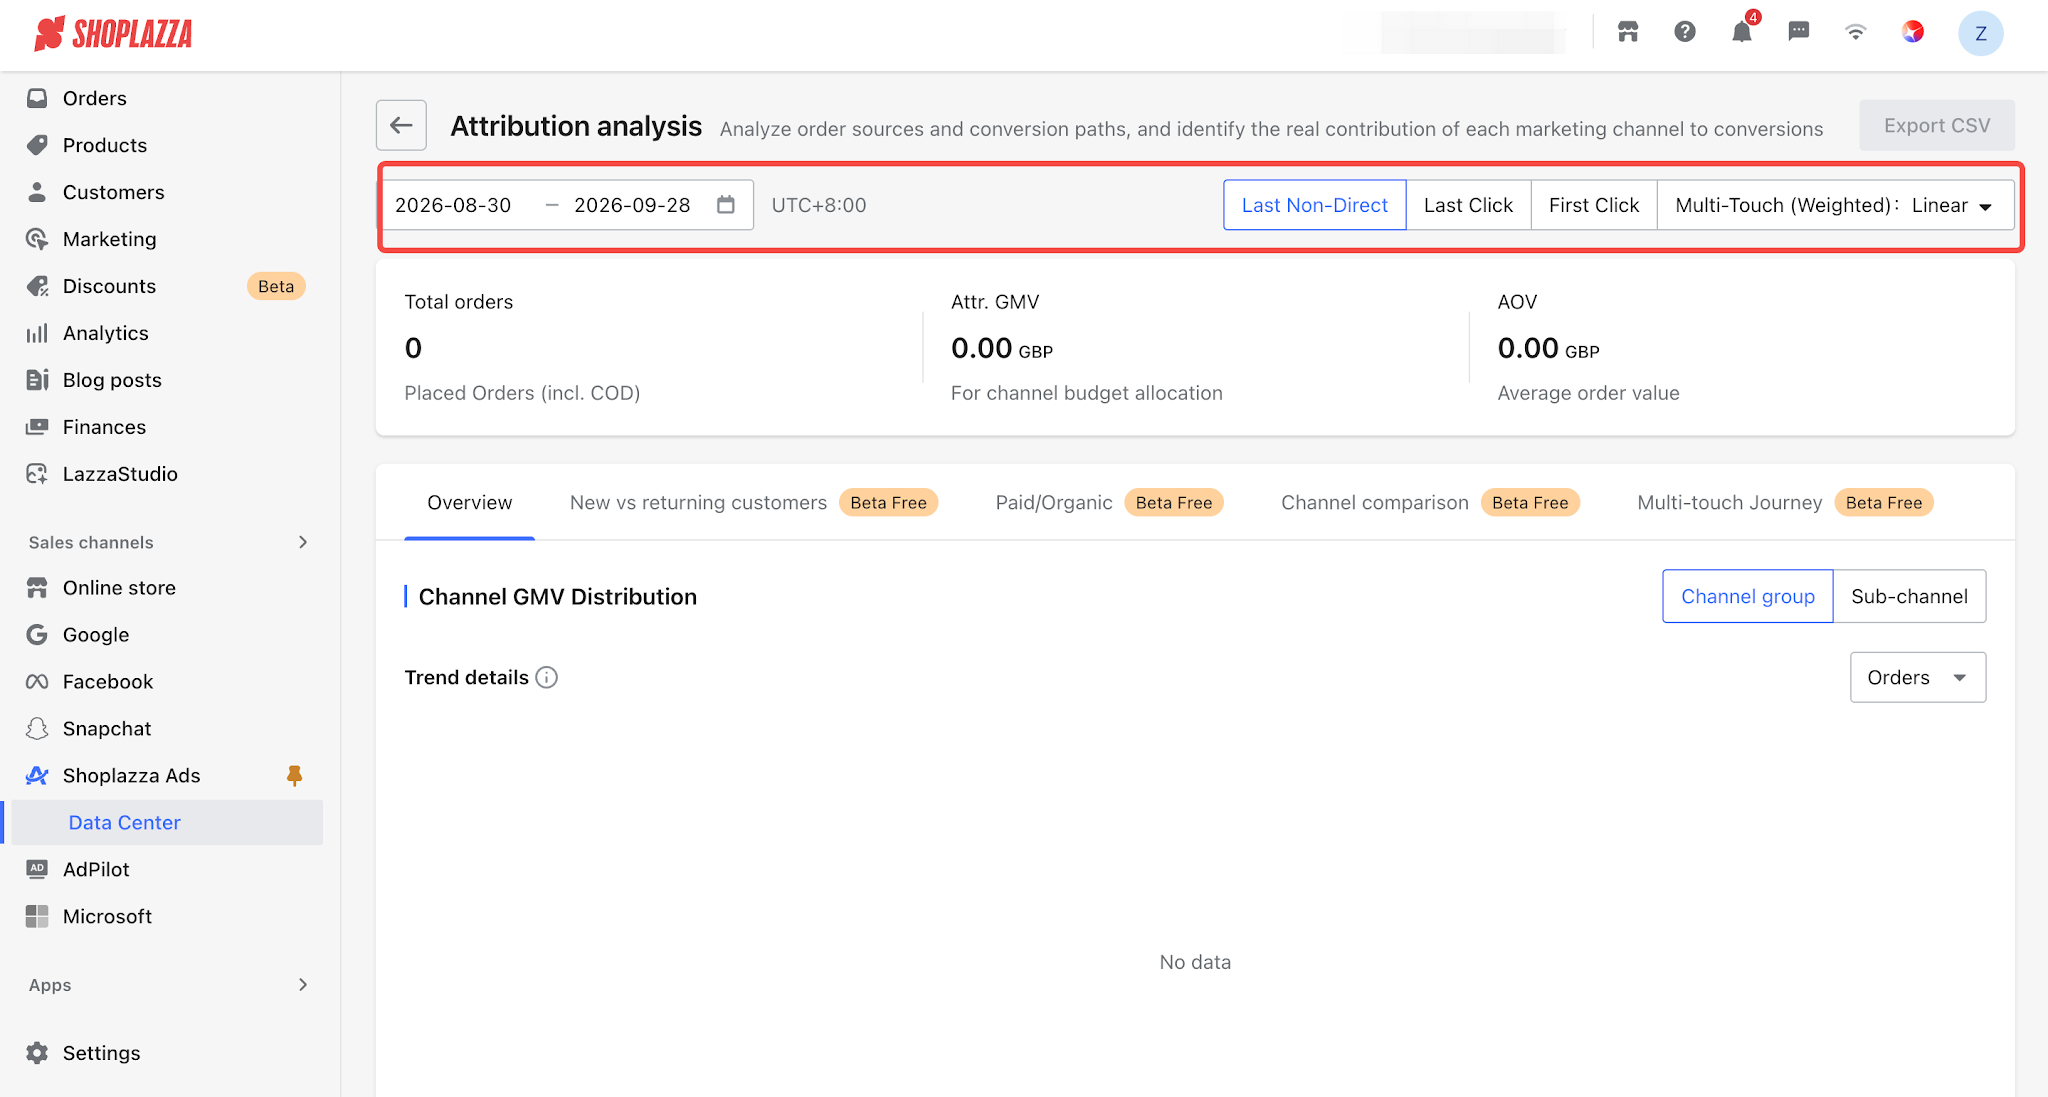
2. Key Metrics: Displays overall metrics such as total orders, attributed GMV, and AOV (Average Order Value). The data in this section is not affected by the selected attribution model. When you switch attribution models, only the channel allocation results below will change.
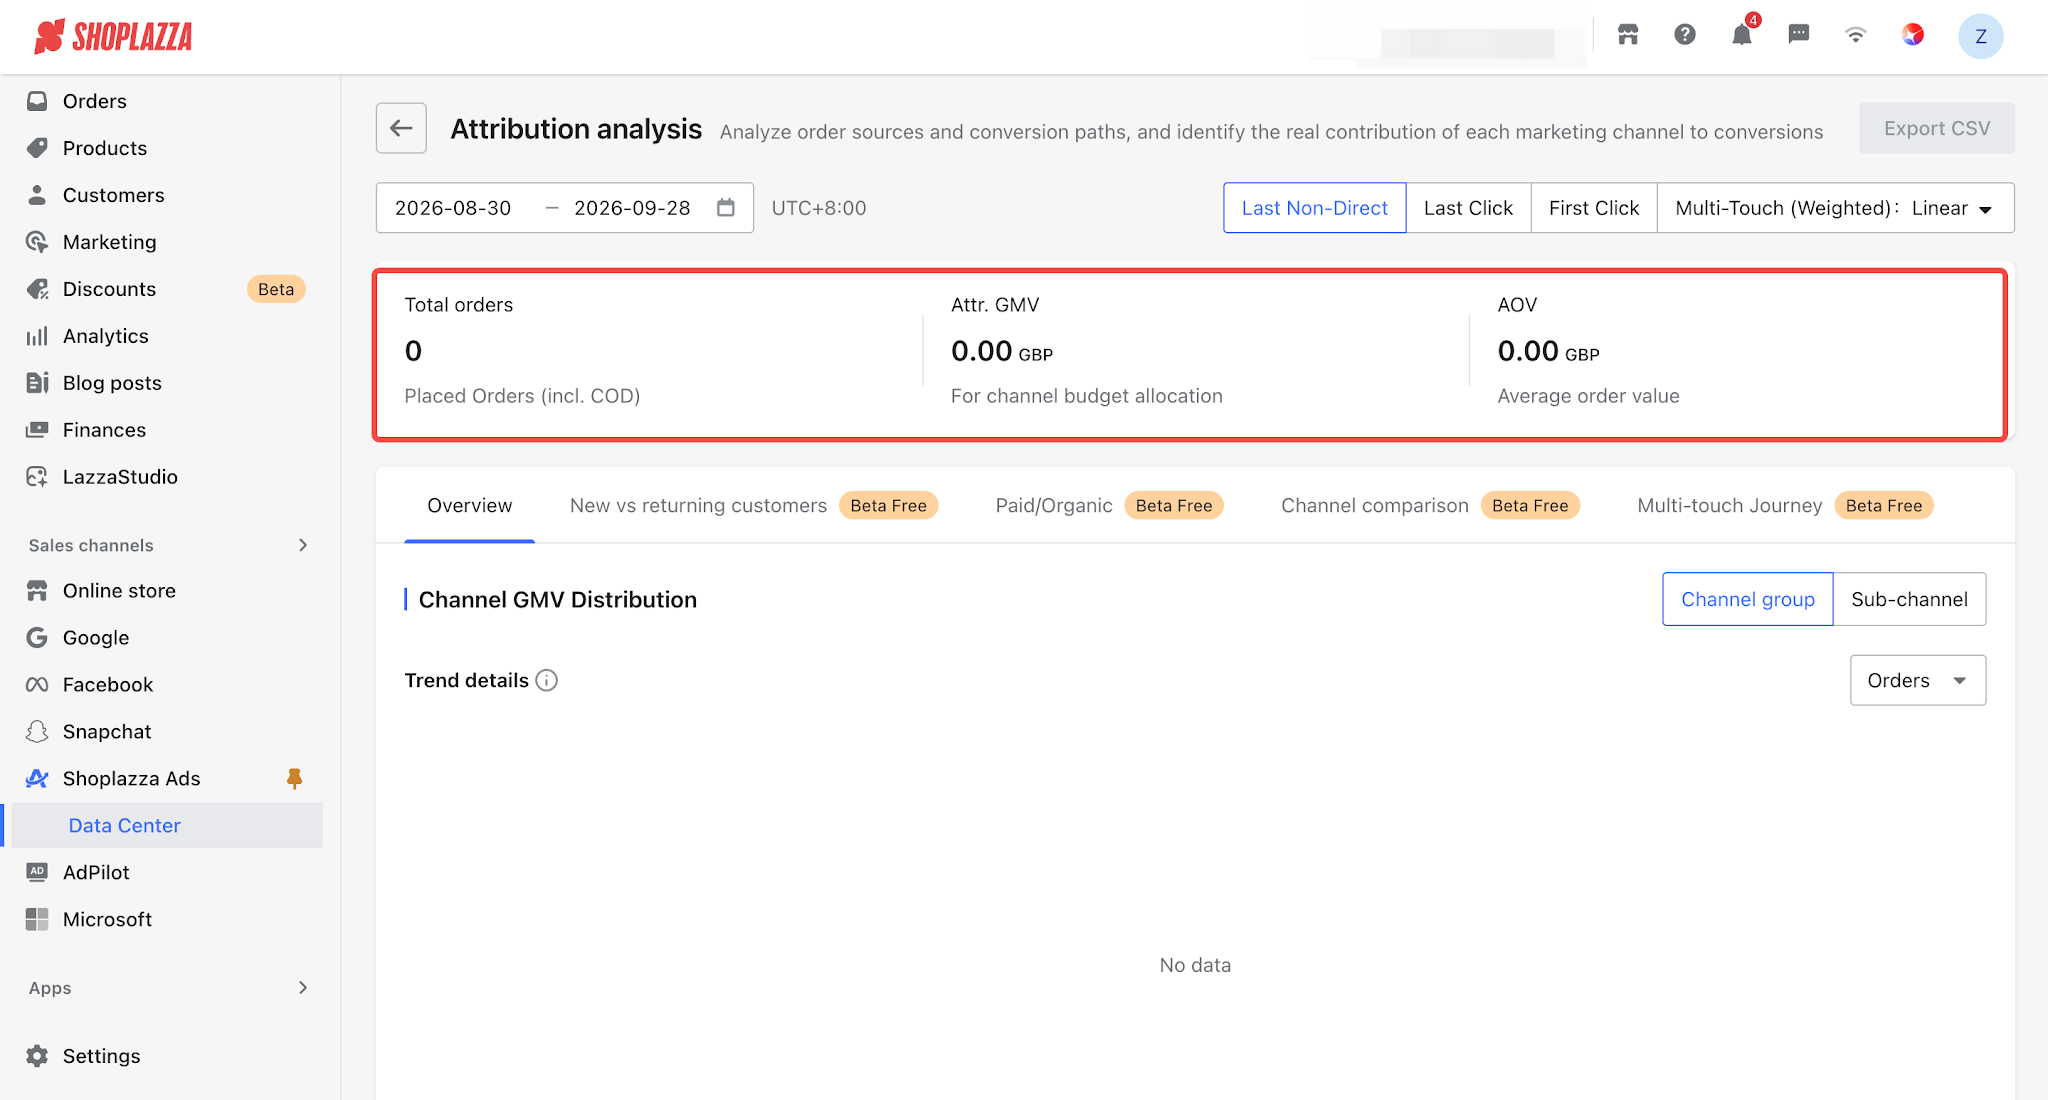
3. The section below consists of five tabs. When switching between tabs, the selected date range, time zone, and attribution model remain unchanged.
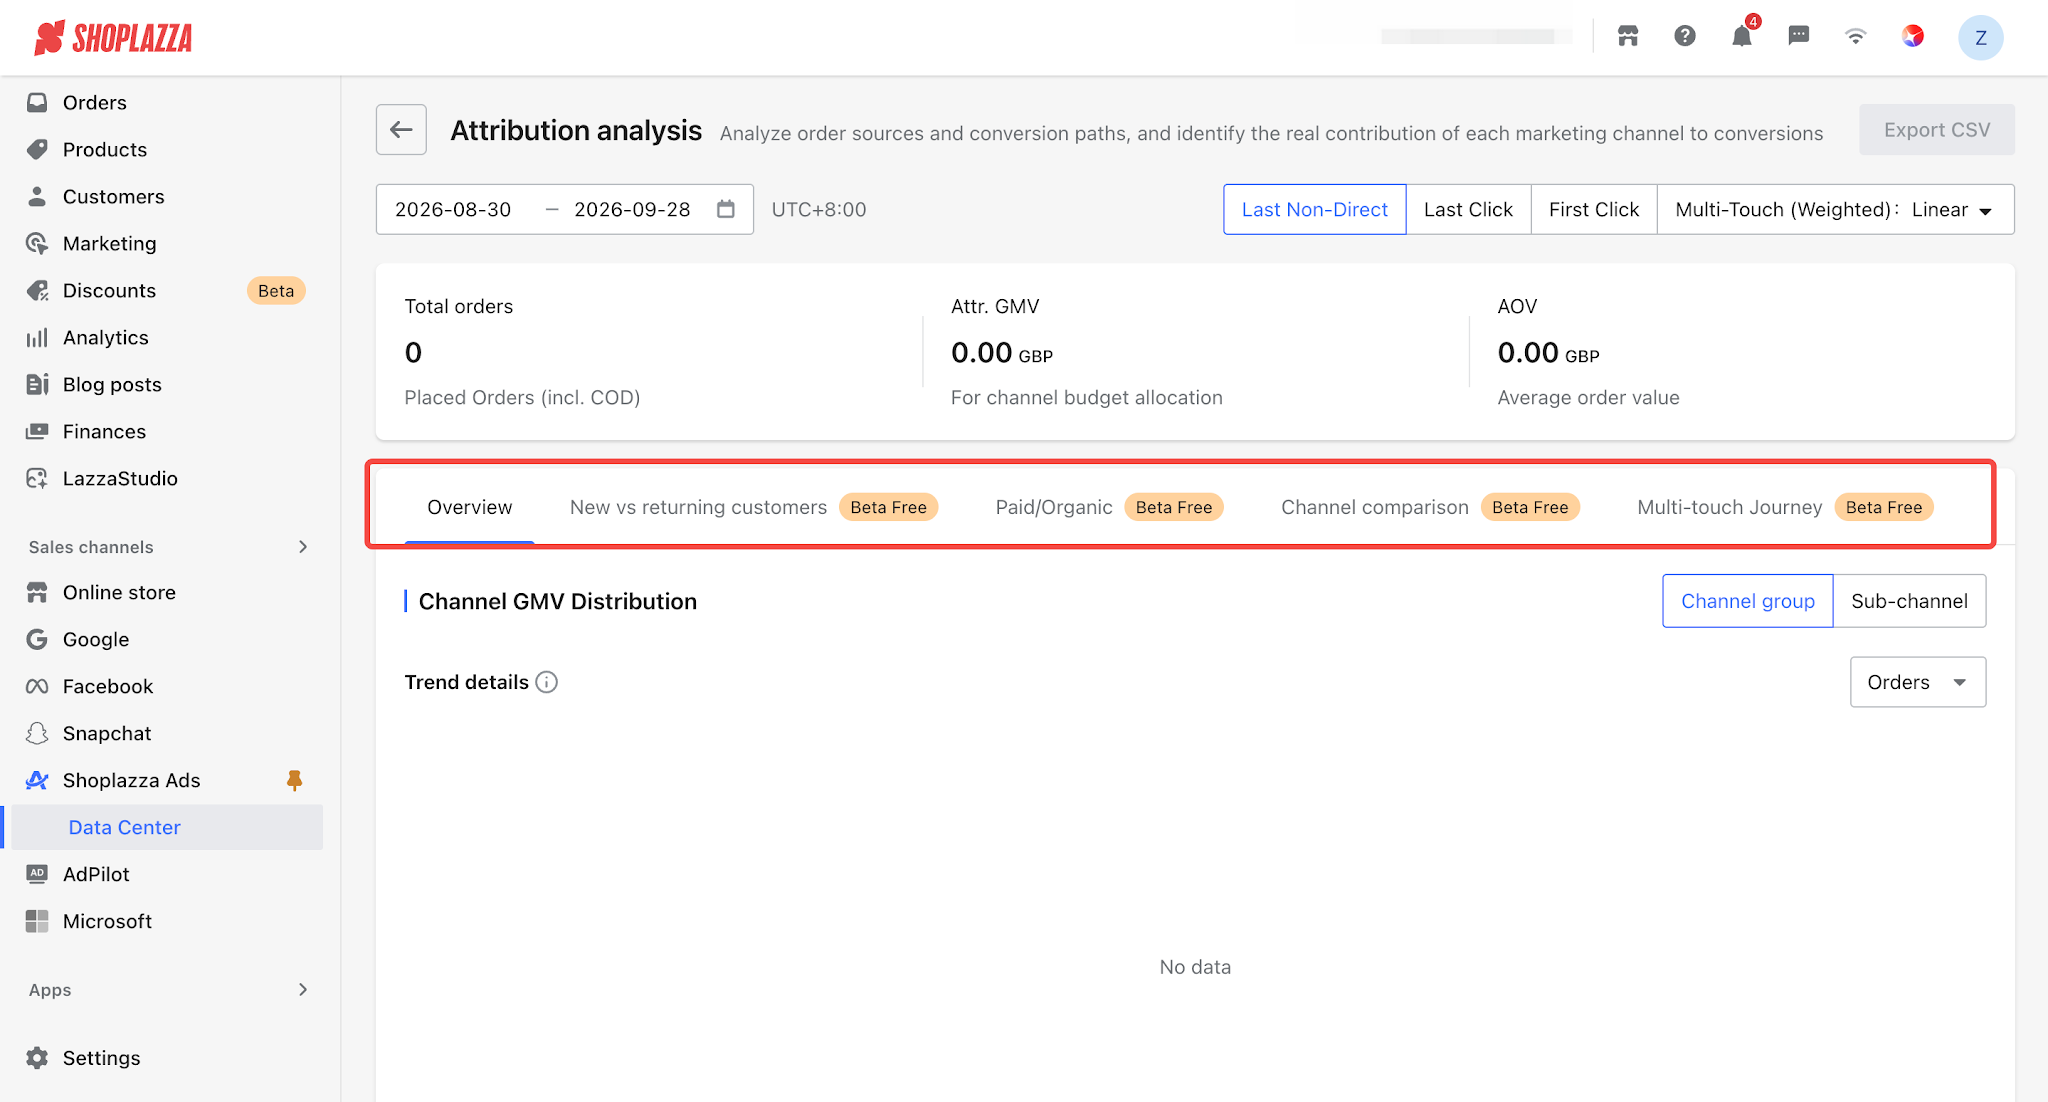
Tab 1: Overview
This section provides an overview of overall order and GMV metrics, channel contributions, and trends, helping you quickly understand the store’s overall attribution performance and changes in channel contributions.
How to use: First, review the channels with the largest contributions in [GMV/Orders and Share by Channel], then use the [Trend Details] line chart to view changes in channel contributions over time and determine whether the contribution is sustained or concentrated on a specific day.
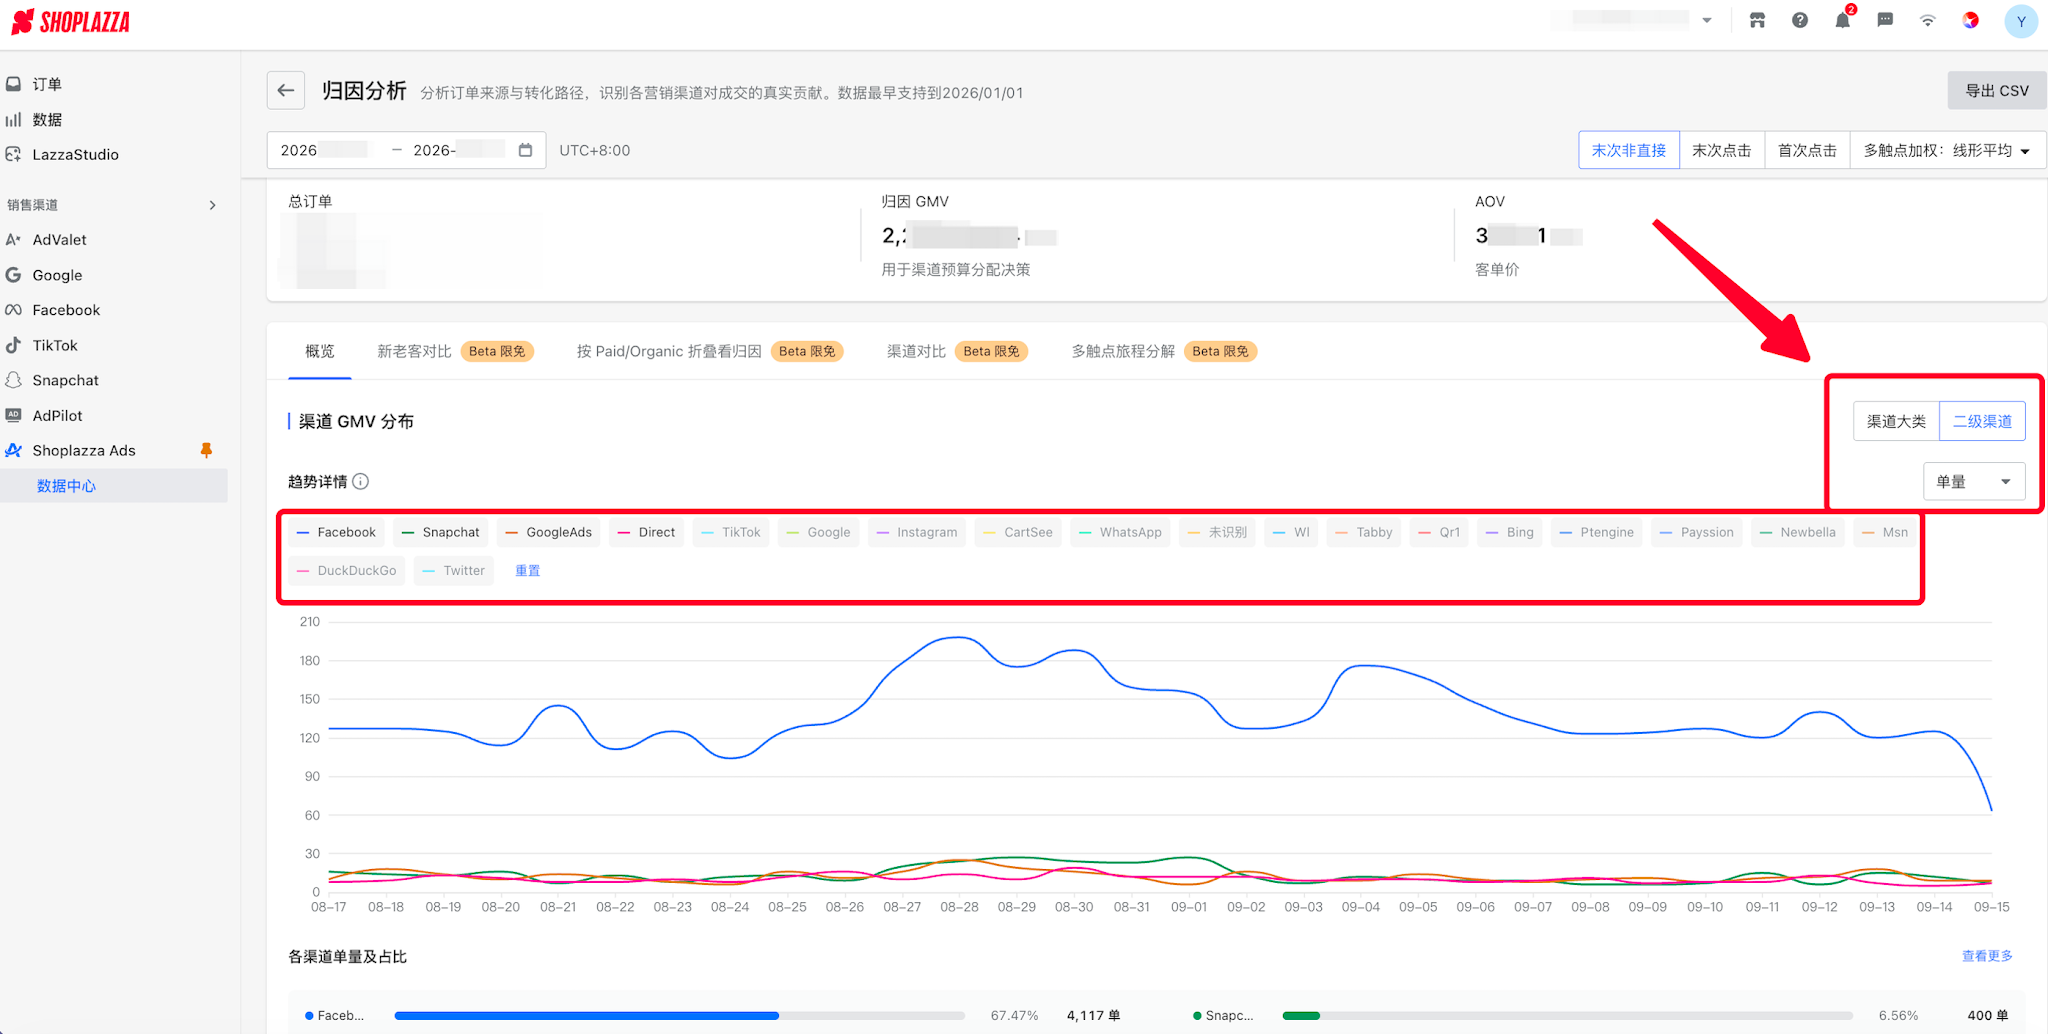
- GMV Distribution by Channel: You can switch between two levels: Channel Category / Sub-channel.
- Trend Details: The line chart displays the daily trends for each channel. You can switch between metrics (Orders / GMV) in the upper-right corner. The chart legend highlights the top 4 contributing channels by default, with options to select or deselect channels individually or reset the selection with one click.
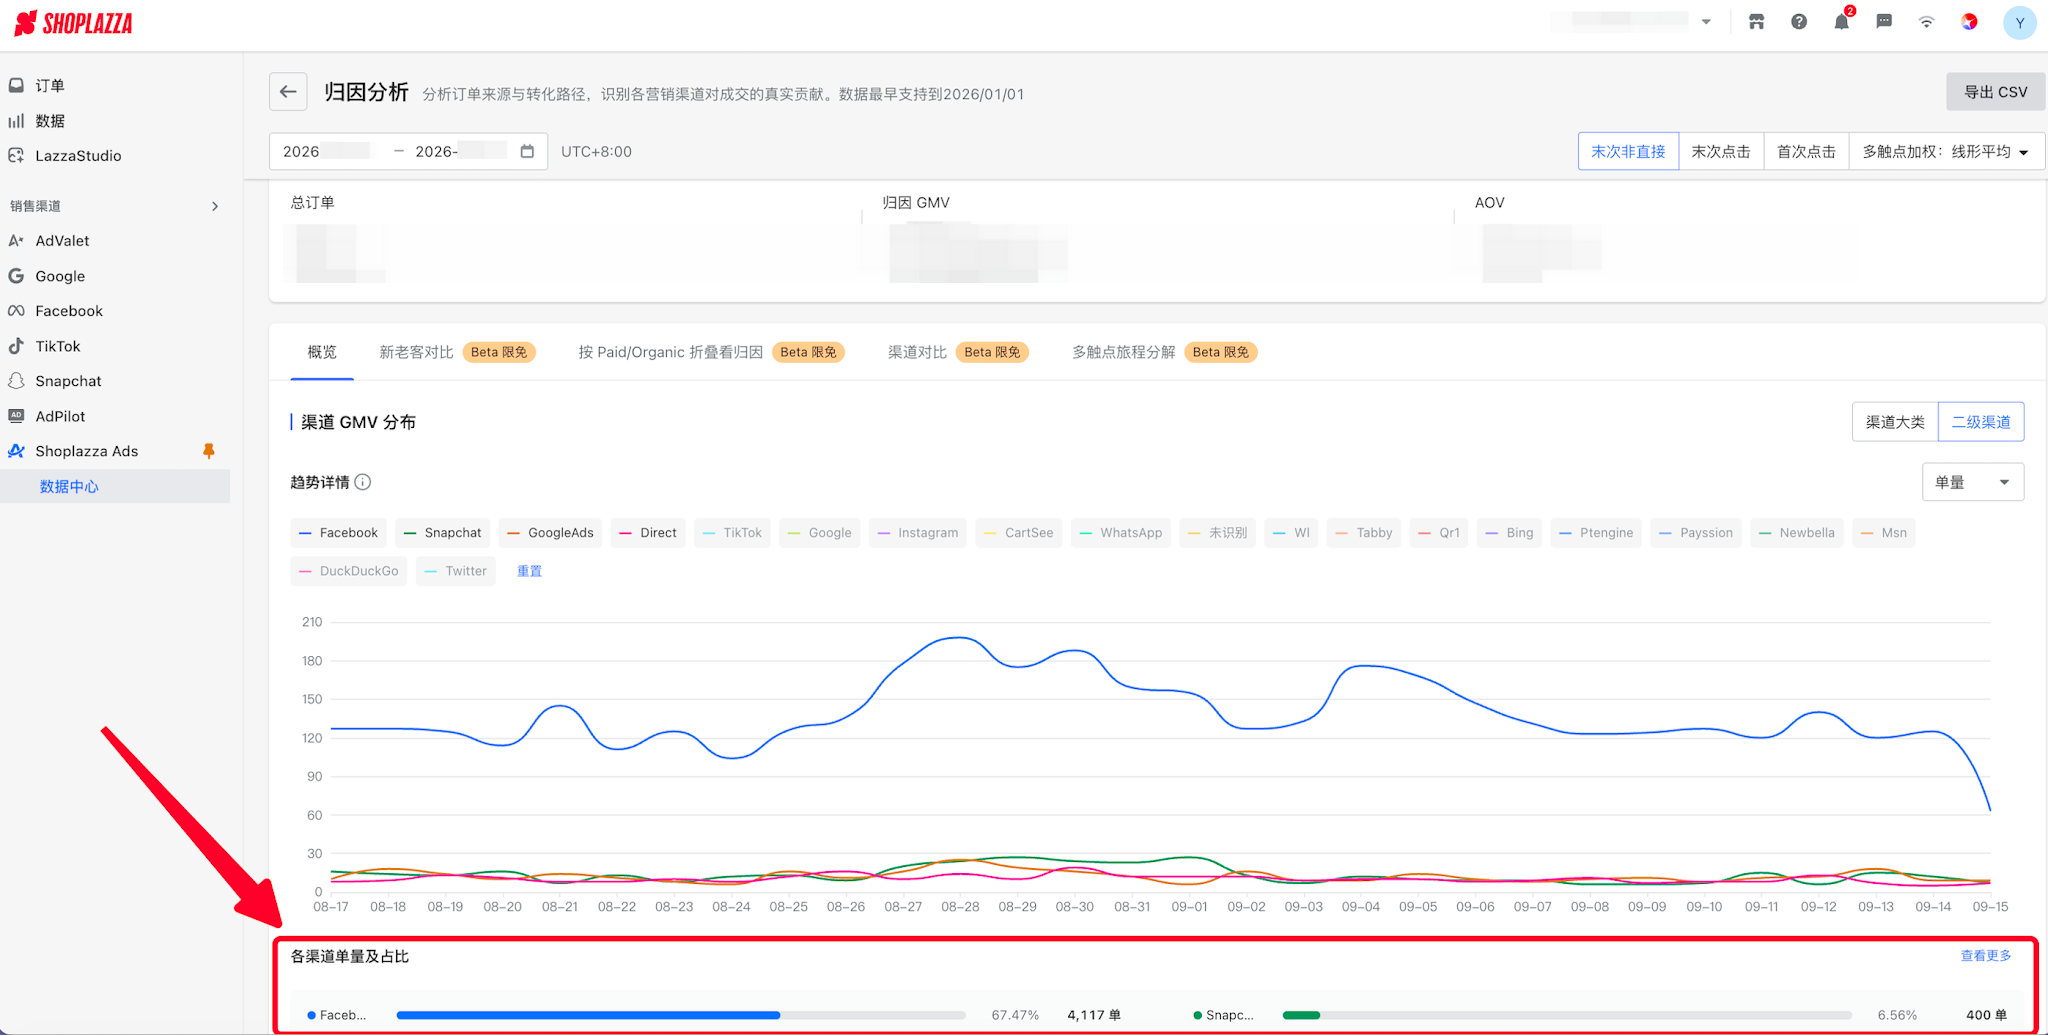
- GMV/Orders and Share by Channel: Lists the amount and share for each channel. The denominator for the share is the total attributed GMV. When you click “View More” to expand the long-tail channels, the share values remain unchanged.
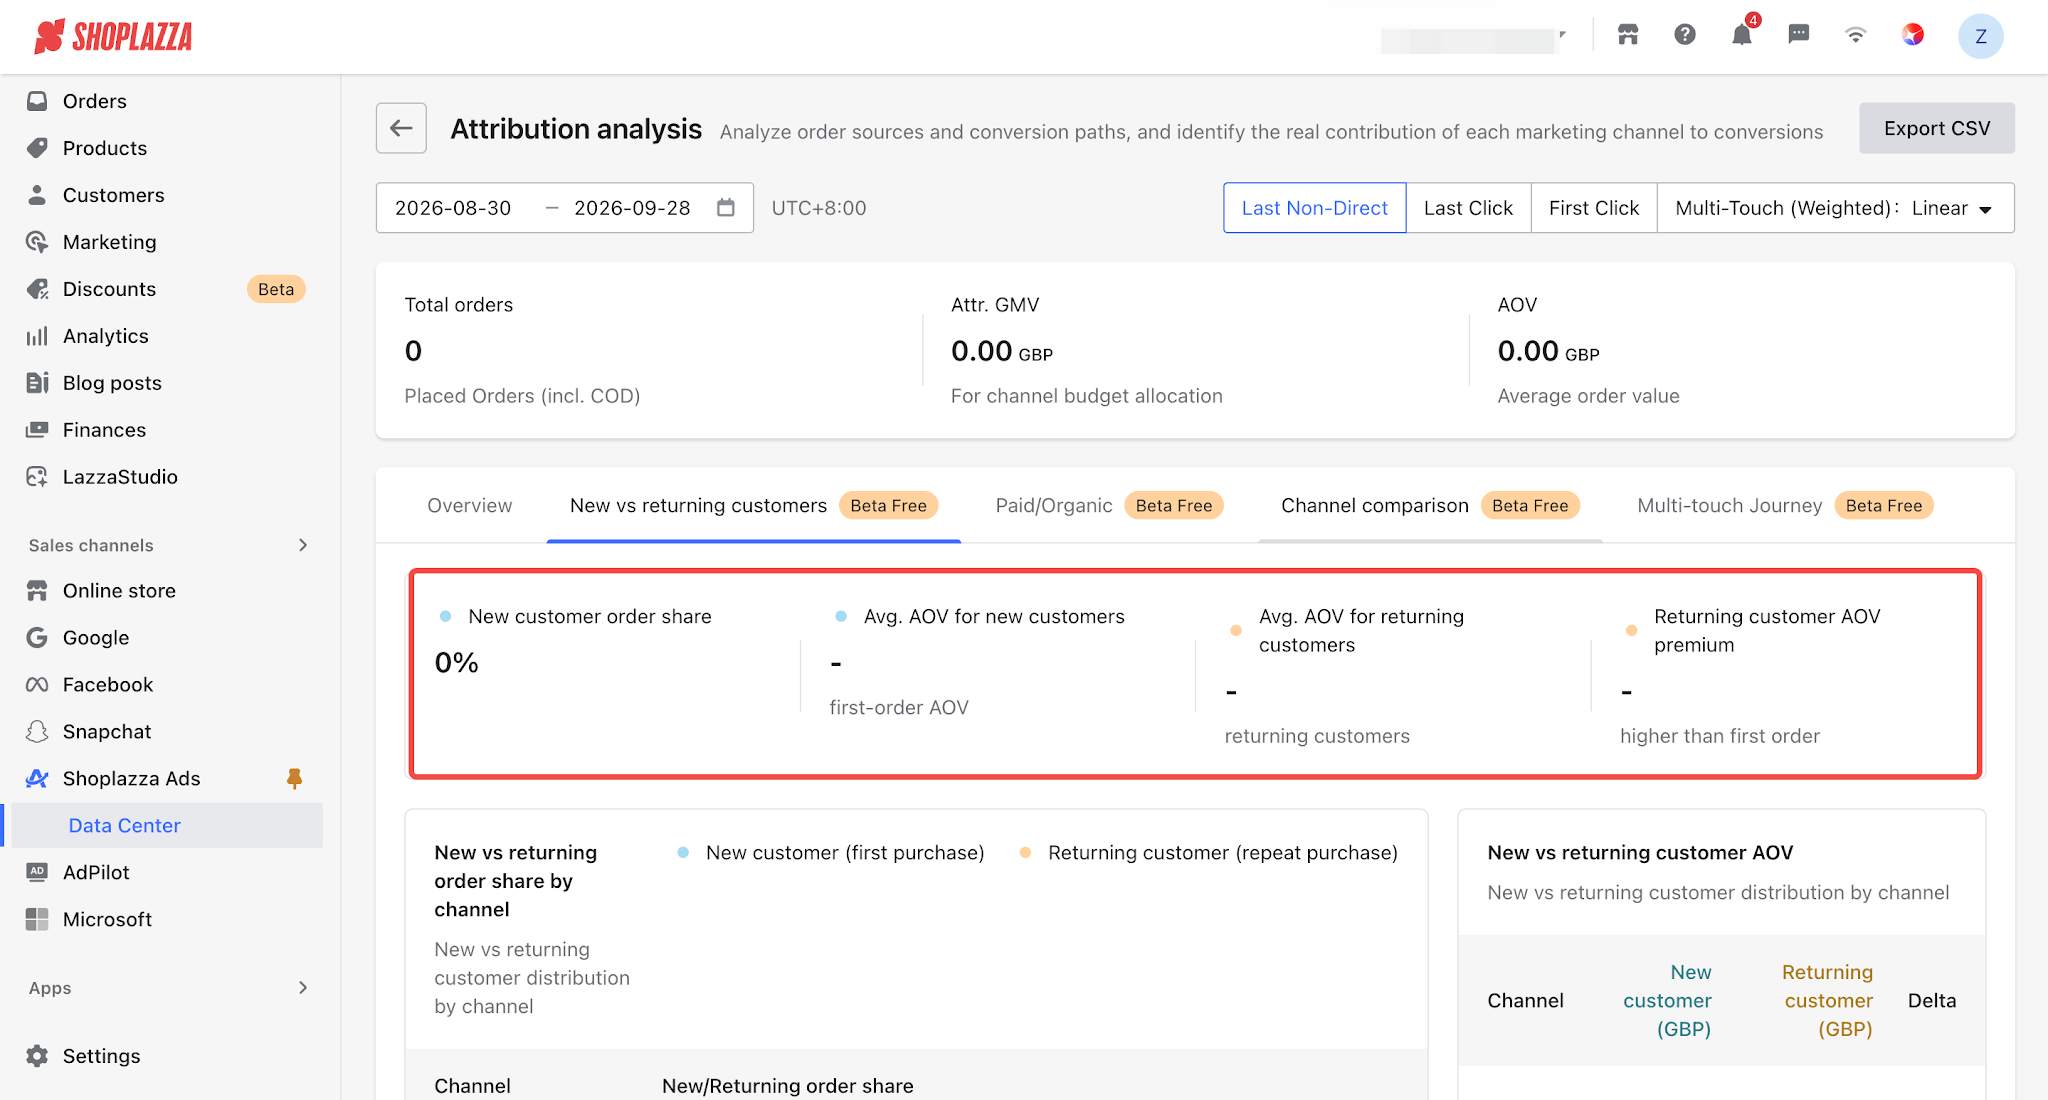
Tab 2: New vs. Returning Customers
How to use: Analyze the proportion of new and returning customers to understand each channel’s customer acquisition performance and identify the channels that are actually driving new customer acquisition. New and returning customers are determined based on the customer’s historical first order date, regardless of the currently selected date range.
- Key Metrics: View the New Customer Order Share, Average AOV for New Customers, Average AOV for Returning Customers, and Returning Customer Premium (AOV).
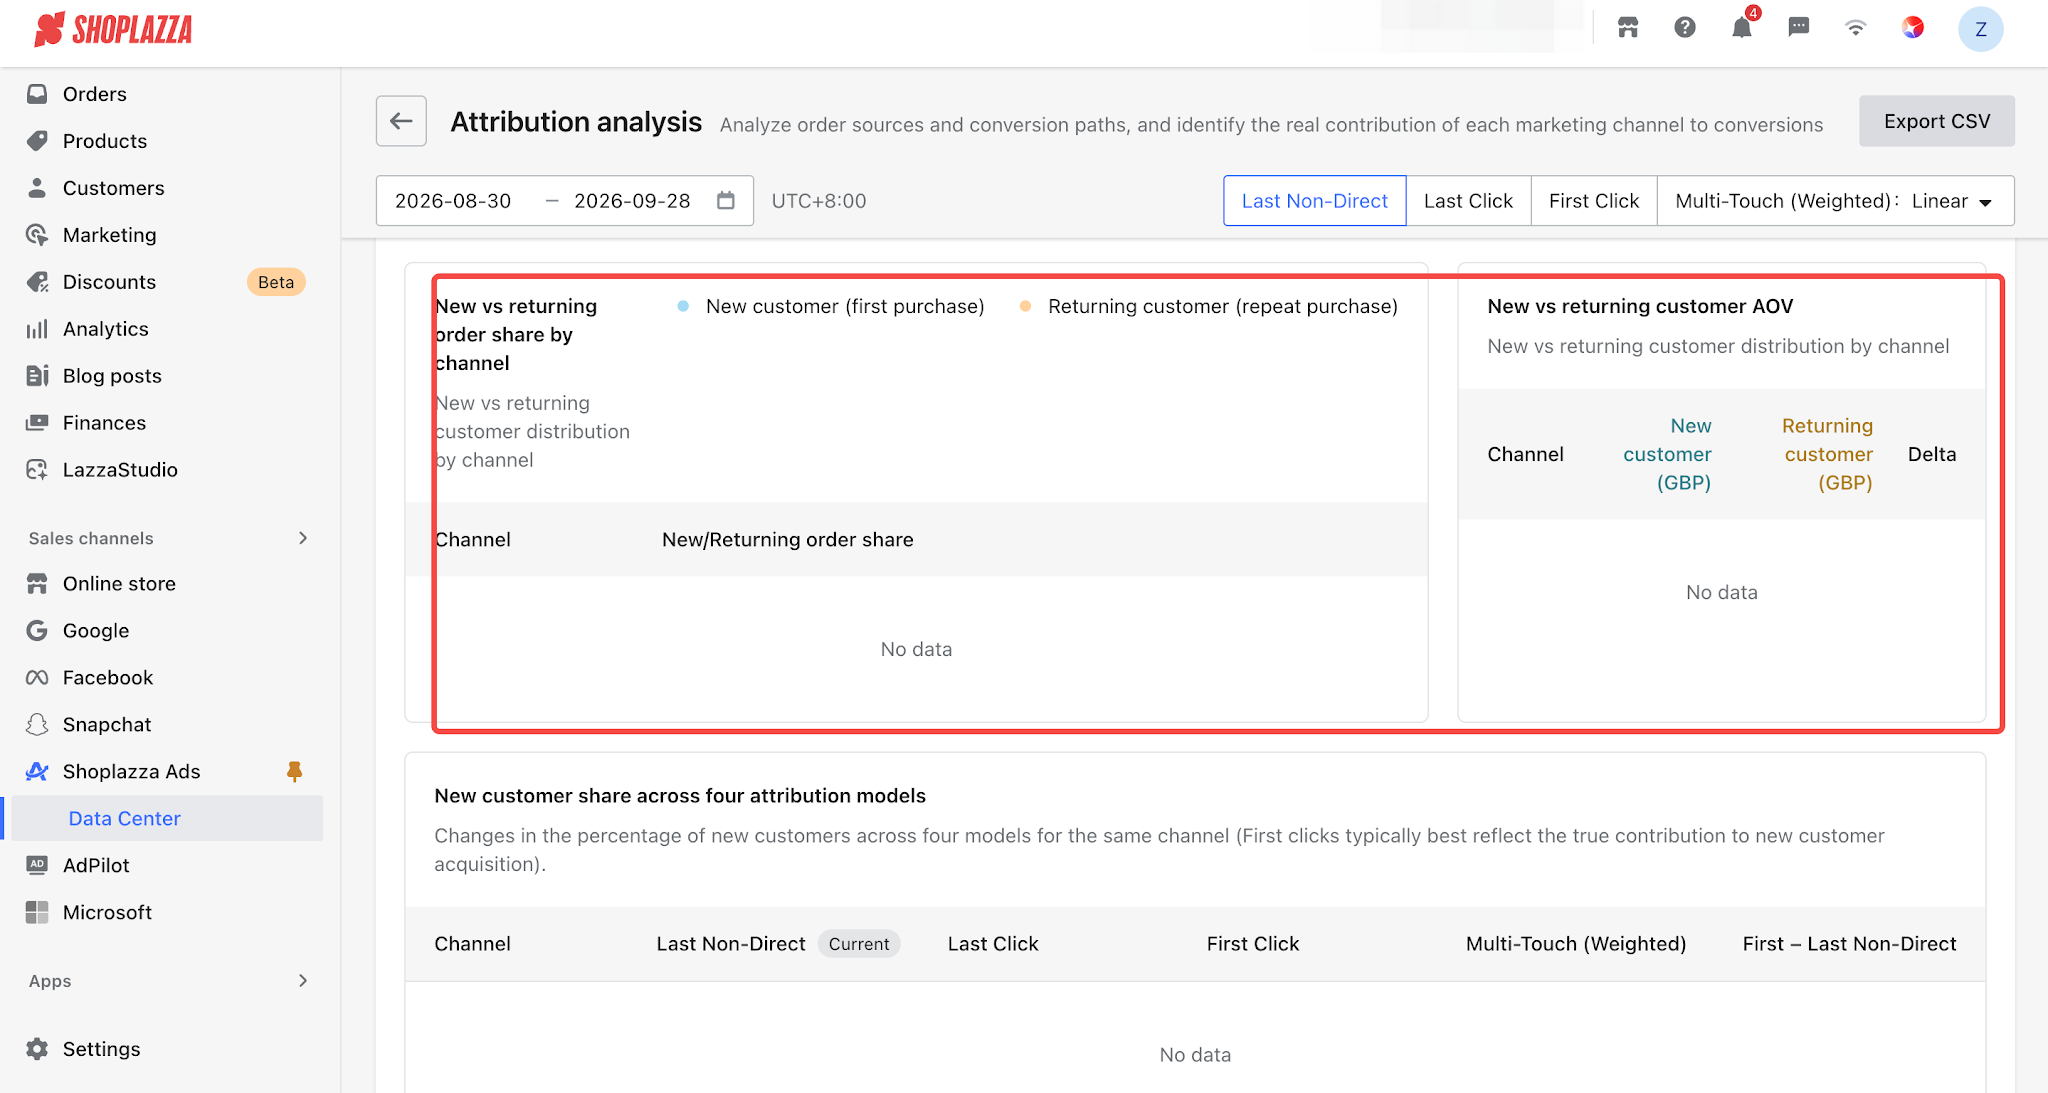
- New vs. Returning Customer Share by Channel: Shows the proportion of new and returning customer orders brought in by each channel (Facebook / Google Ads / …).
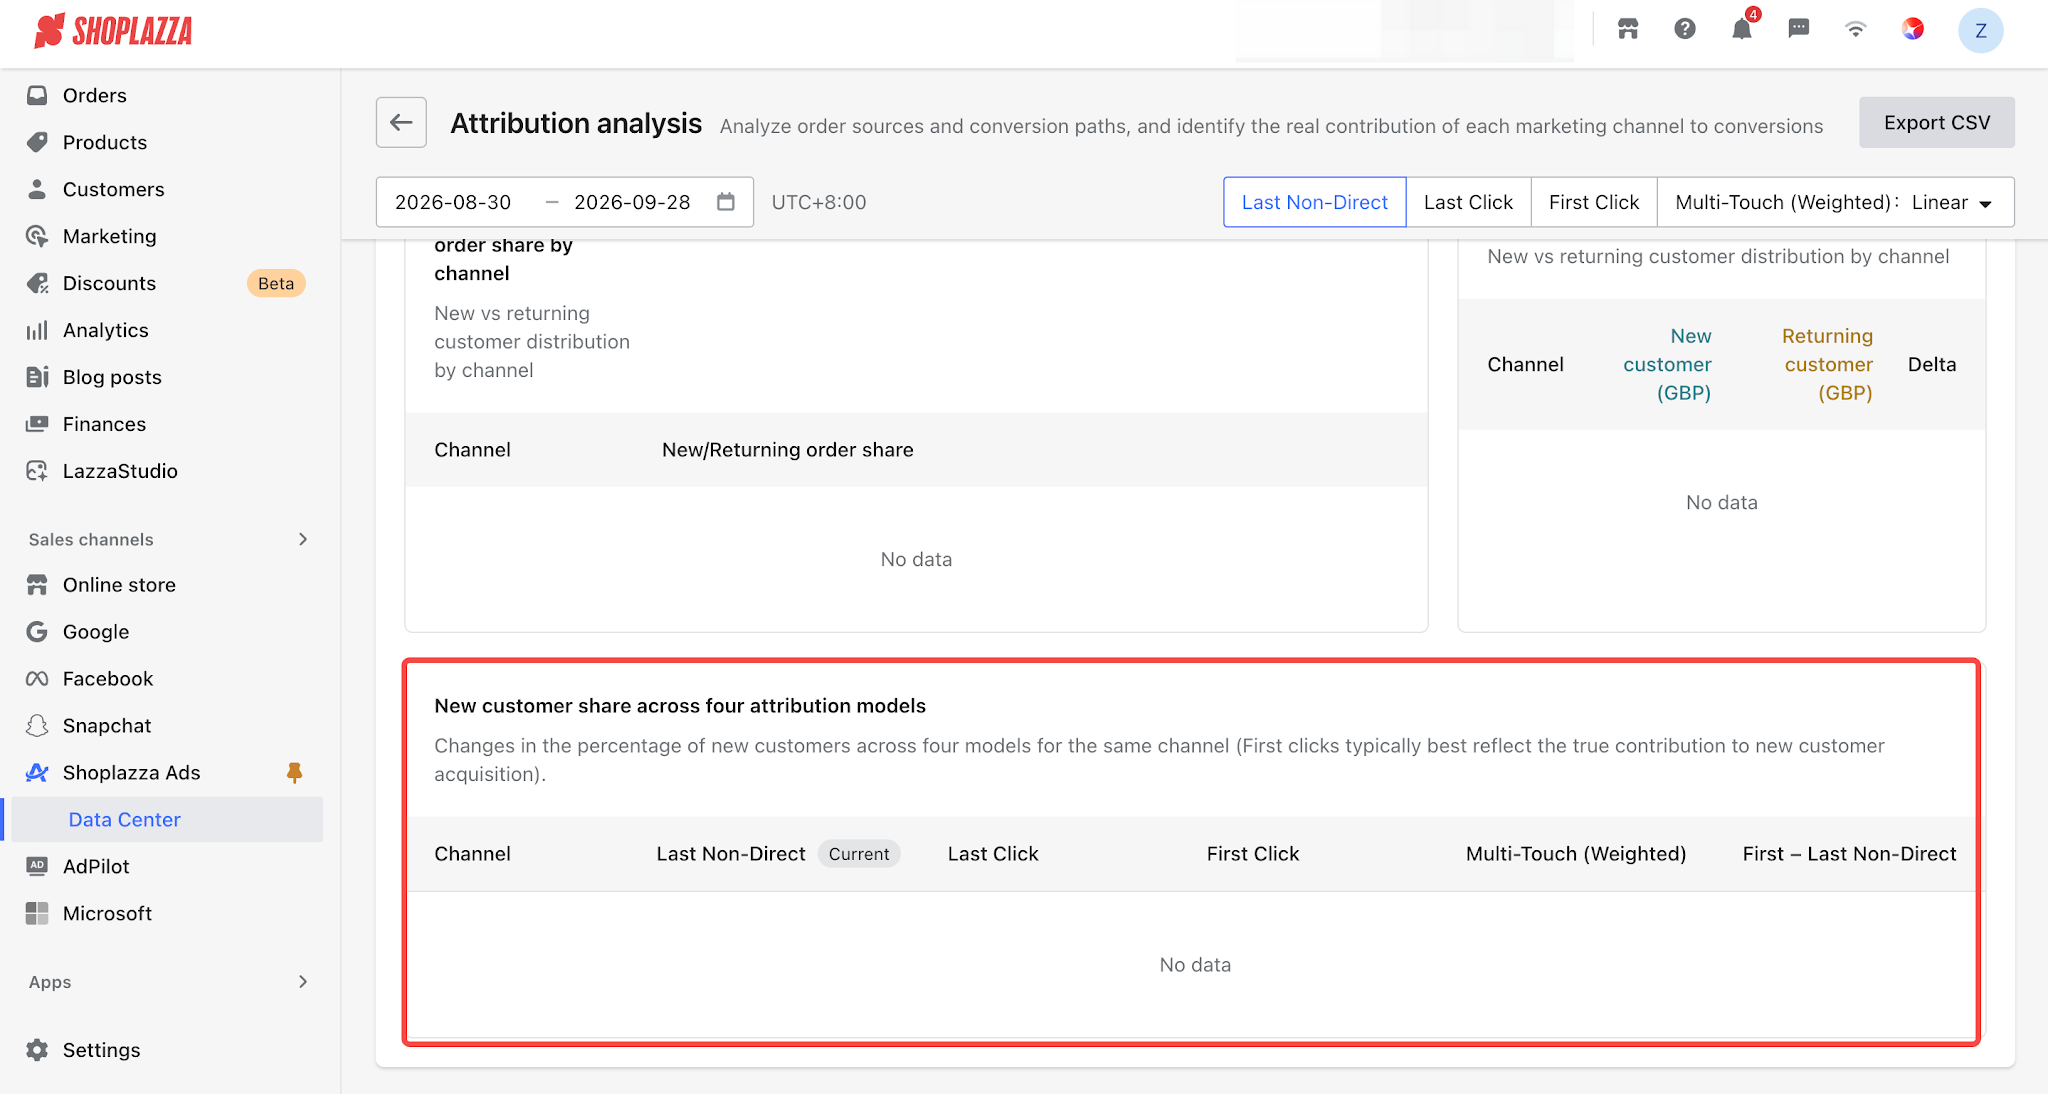
- New Customer Share Comparison Across Attribution Models: Compares the new customer share of each channel for the same set of orders under different attribution models.
Tab 3: Attribution by Paid/Organic Traffic
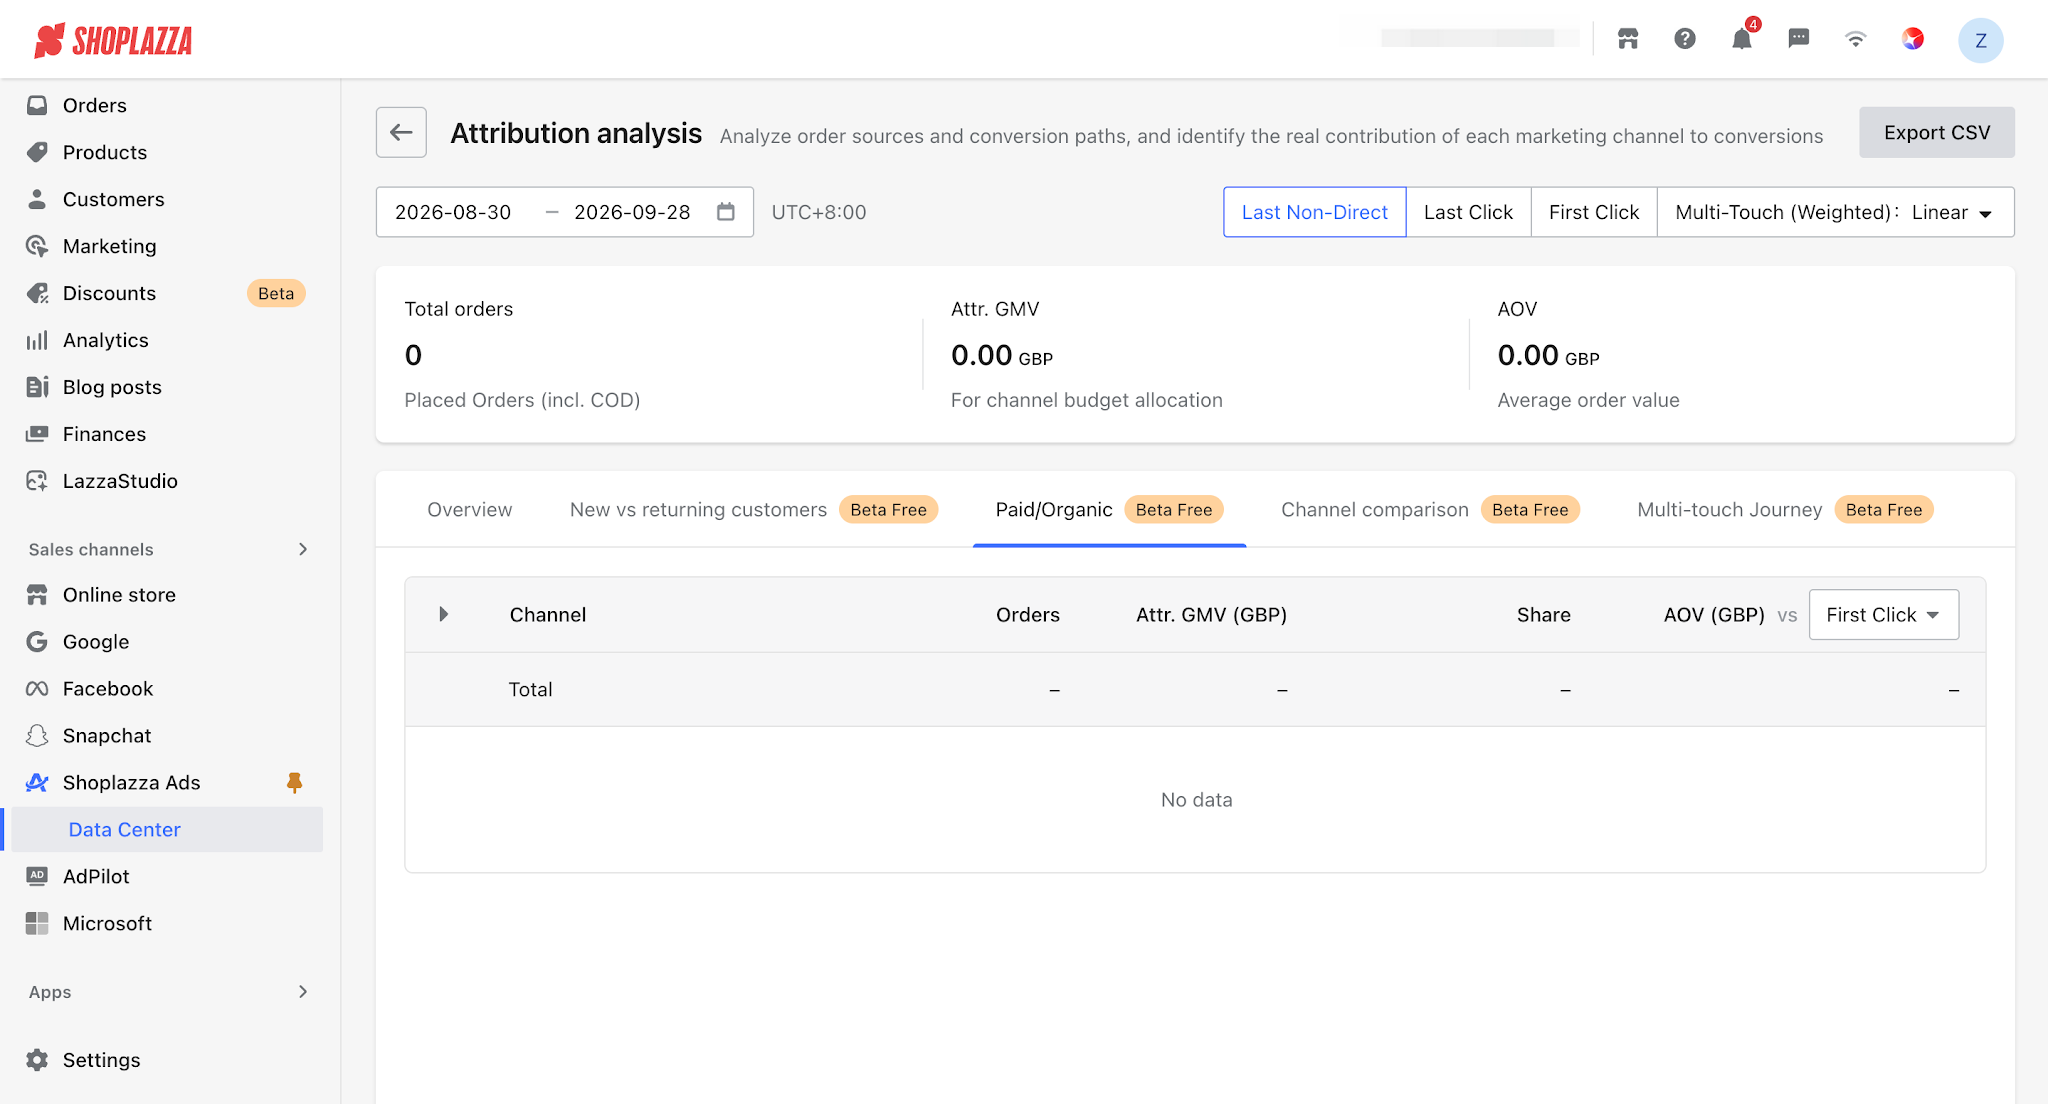
How to use: Combine trends in paid and organic traffic with actual advertising spend to assess the overall traffic structure. If organic traffic remains low over time, you can focus on customer retention and organic traffic growth. If spending on organic and paid traffic is similar but the returns are relatively low, you can further evaluate budget allocation or optimize your organic traffic strategy.
- Category Collapsible View: Groups channels into Paid Traffic / Organic Traffic / Direct Traffic to display attributed orders and sales. Expand any category to view the channels included within it.
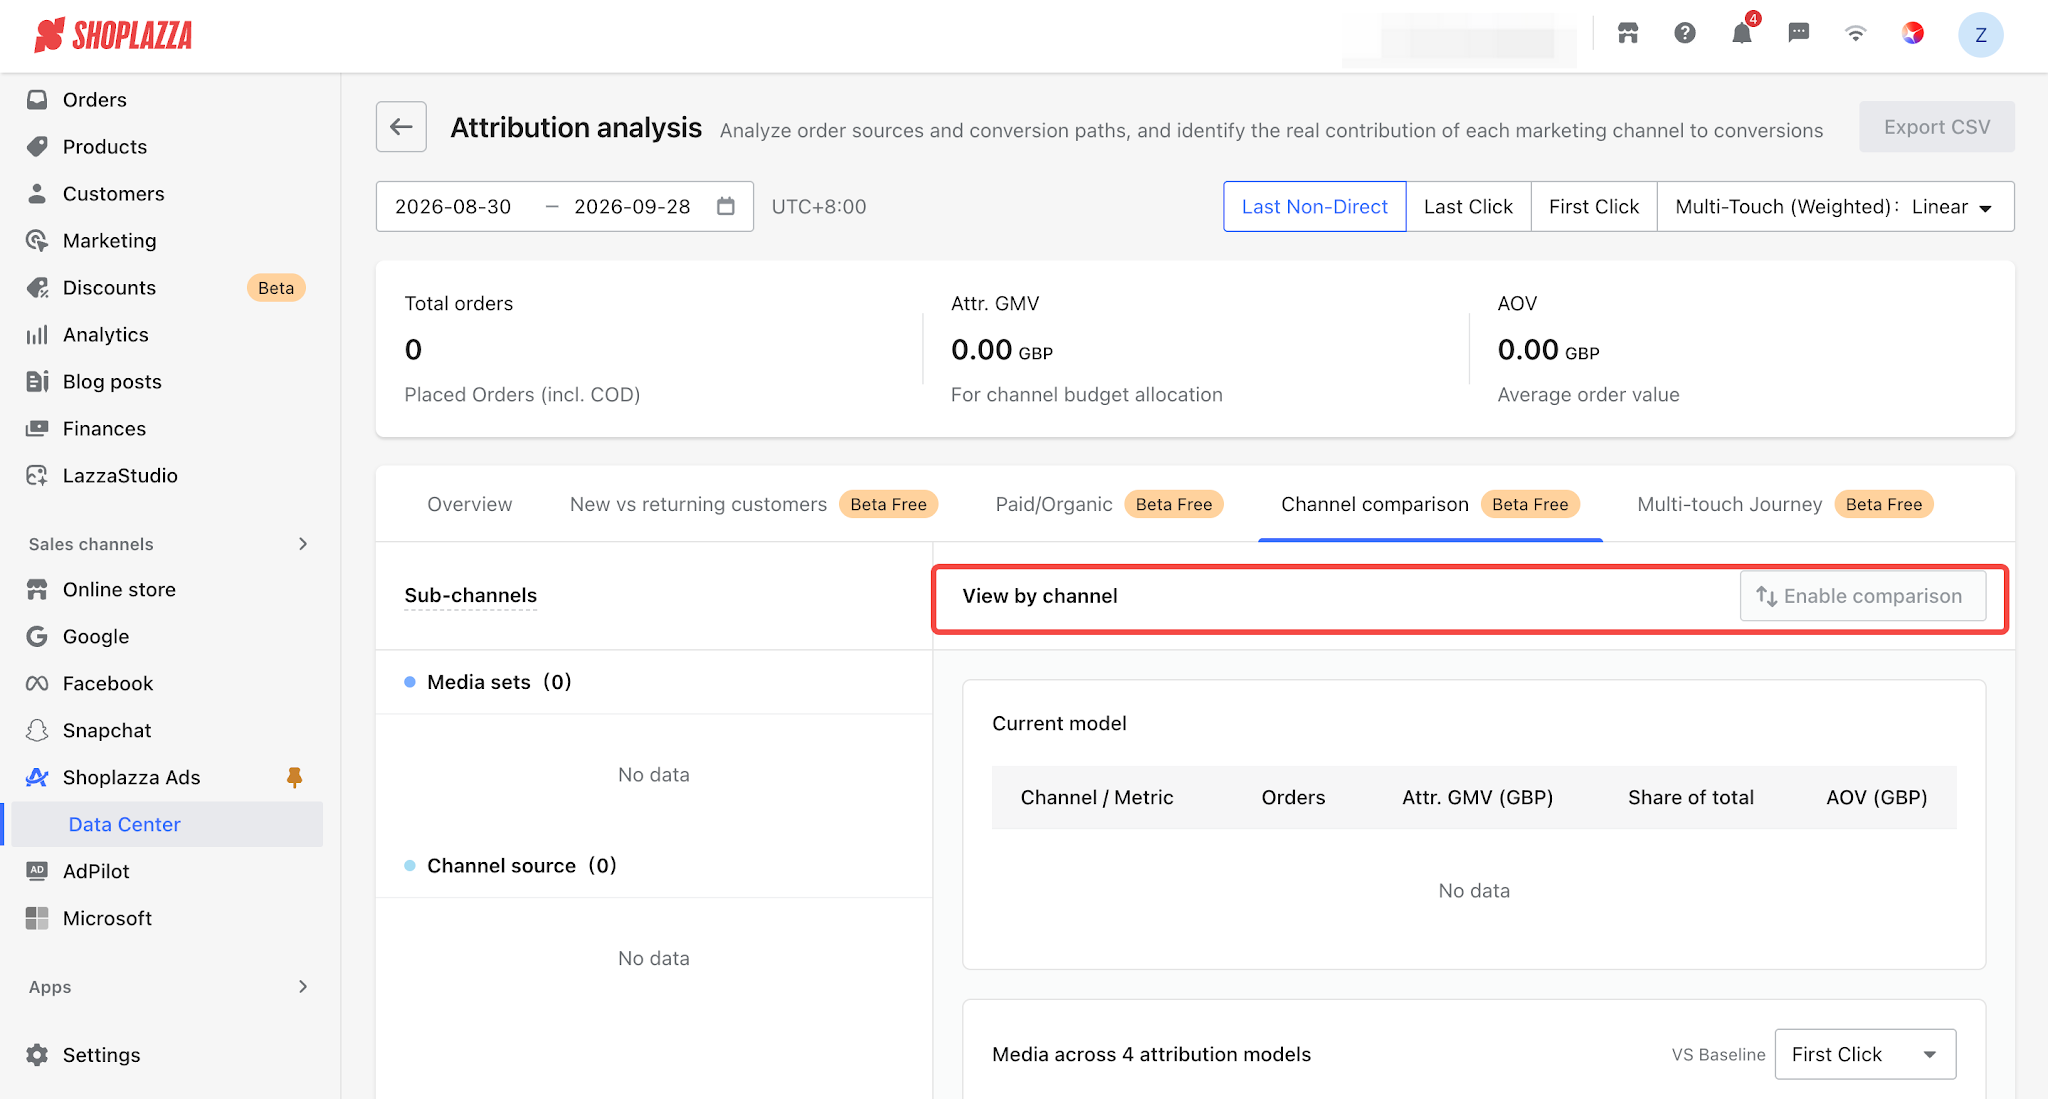
Tab 4: Channel Comparison
- How to use: Select two channels to compare metrics such as orders and sales within the same date range and under the same attribution model. This allows you to clearly see the performance differences between the two channels and provides a reference for adjusting channel budgets.
Note
Changing the date range will reset the comparison. Please select the channels again.
Tab 5: Multi-Touchpoint Journey Breakdown
Break down the customer’s visit journey before placing an order into different stages, and use different attribution models to analyze each channel’s contribution throughout the customer conversion process. This view is suitable for users who need to conduct an in-depth analysis of multi-channel conversion paths.
How to use: Before adjusting your budget, compare the results under the two attribution models. Don’t focus only on the channel that ultimately drives the conversion; also consider the channels that contribute during the early awareness and consideration stages.
- Journey Breakdown: Breaks down the complete sequence of customer visits before an order based on how close each visit is to the order into three stages: Early Touchpoints → Mid-Stage Awareness → Decision & Conversion, allowing you to see which channels contribute at each stage.
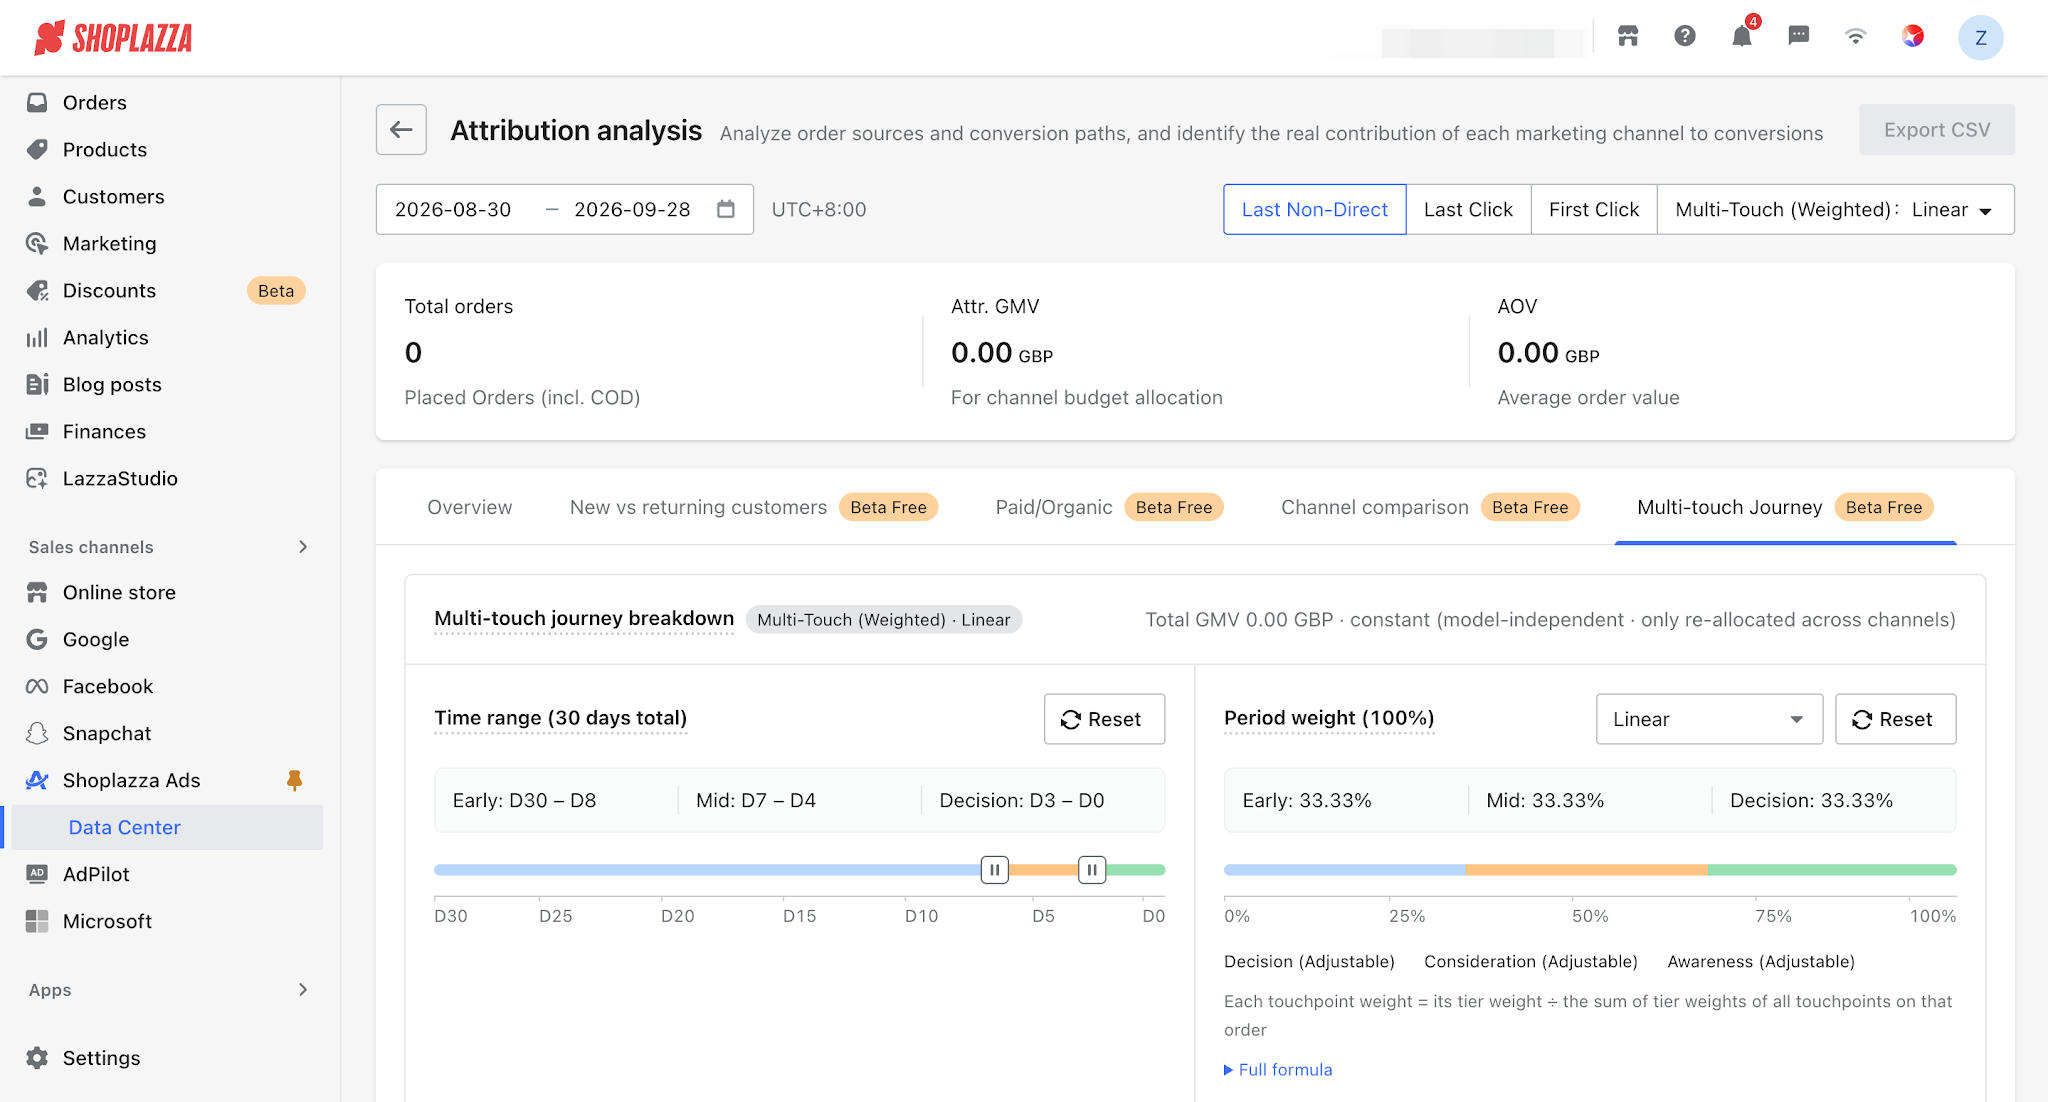
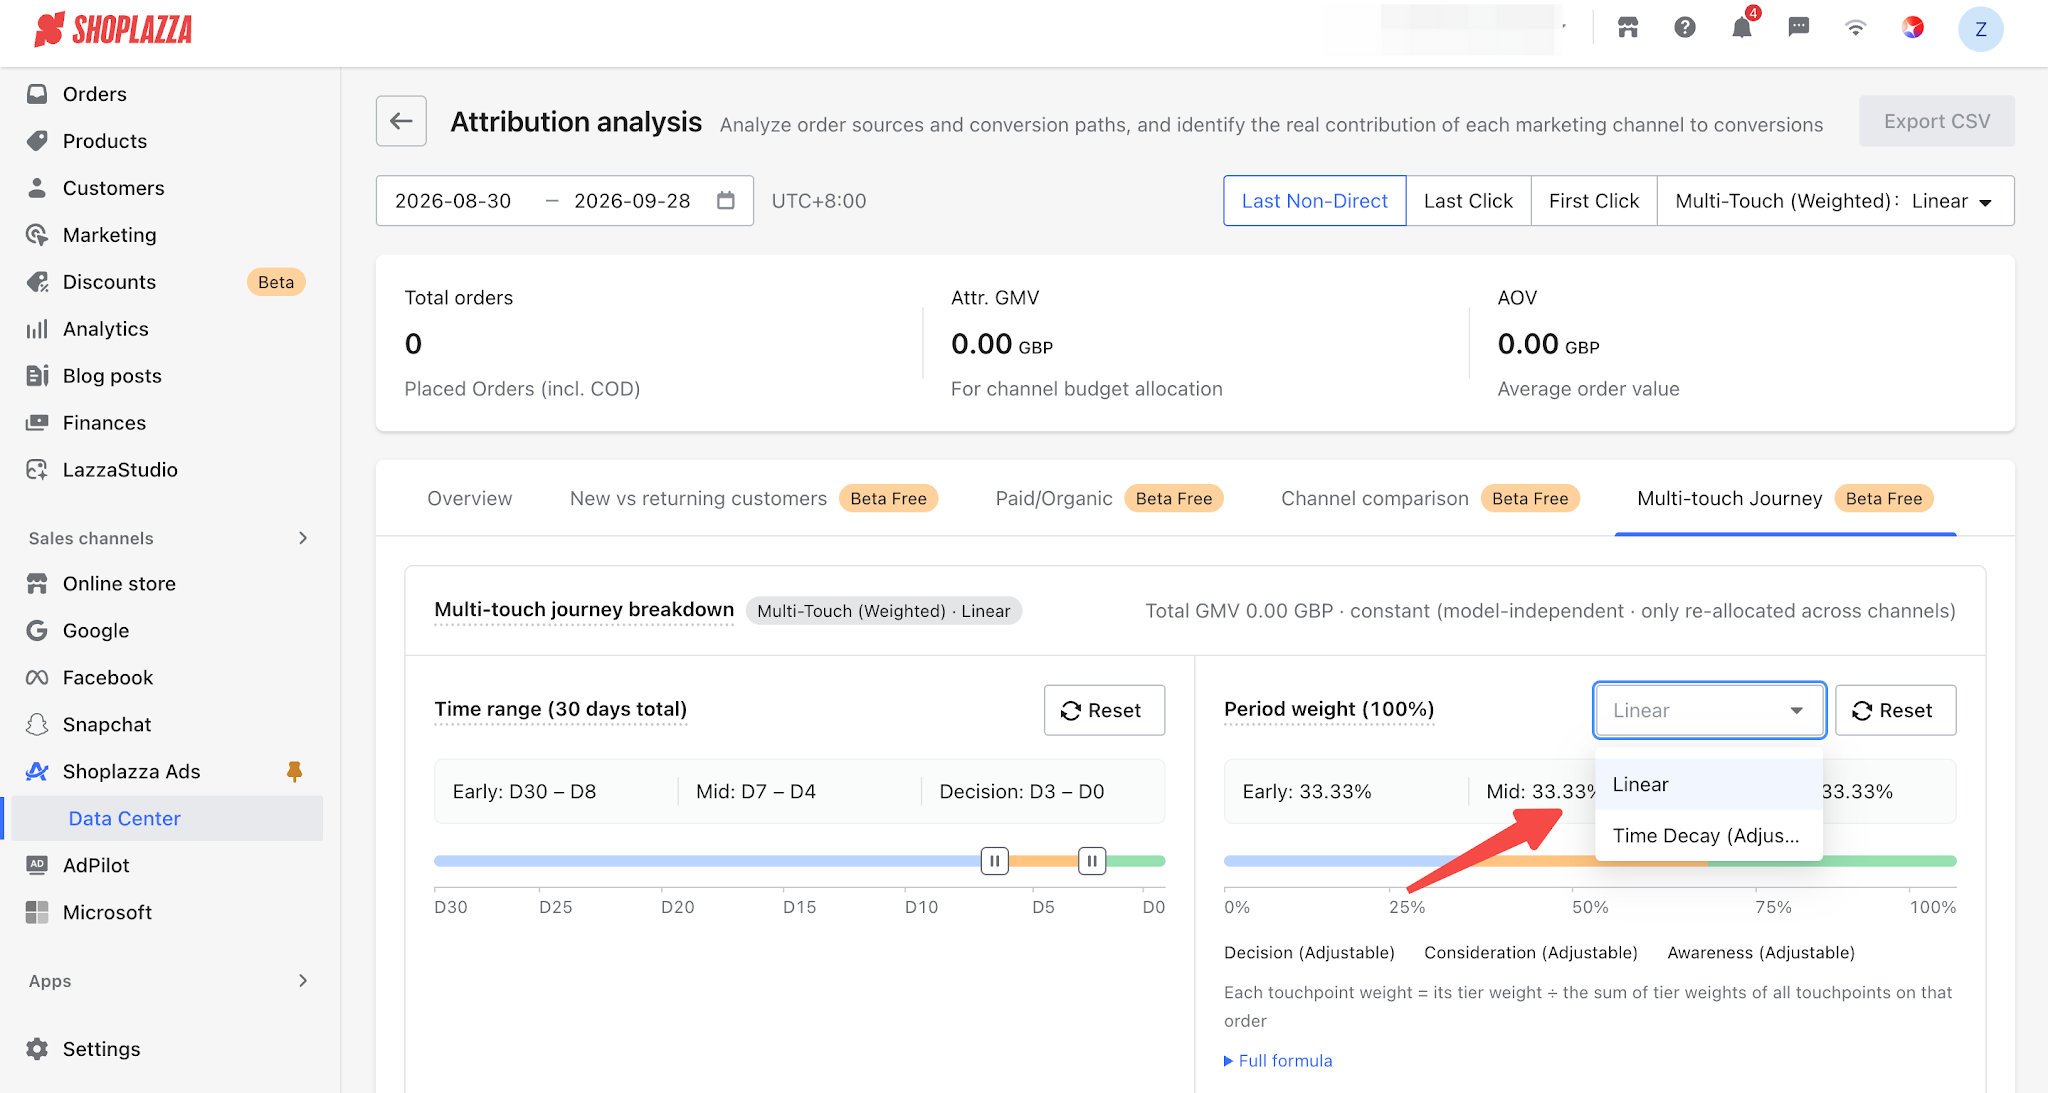
- Two Attribution Models: Provides Linear and Time Decay models to analyze the contribution of multiple channels to order conversions from different perspectives.
- Linear: Distributes the contribution equally across all visits made before the order, regardless of when each visit occurred. This model is suitable for understanding which channels participated throughout the customer’s complete journey before placing an order.
- Time Decay: Assigns contribution based on how close each visit occurred to the order. Visits closer to the time of purchase receive a higher contribution. This model is suitable for identifying which channels played a greater role closer to the final conversion and which channels were mainly involved during the customer’s earlier visits.
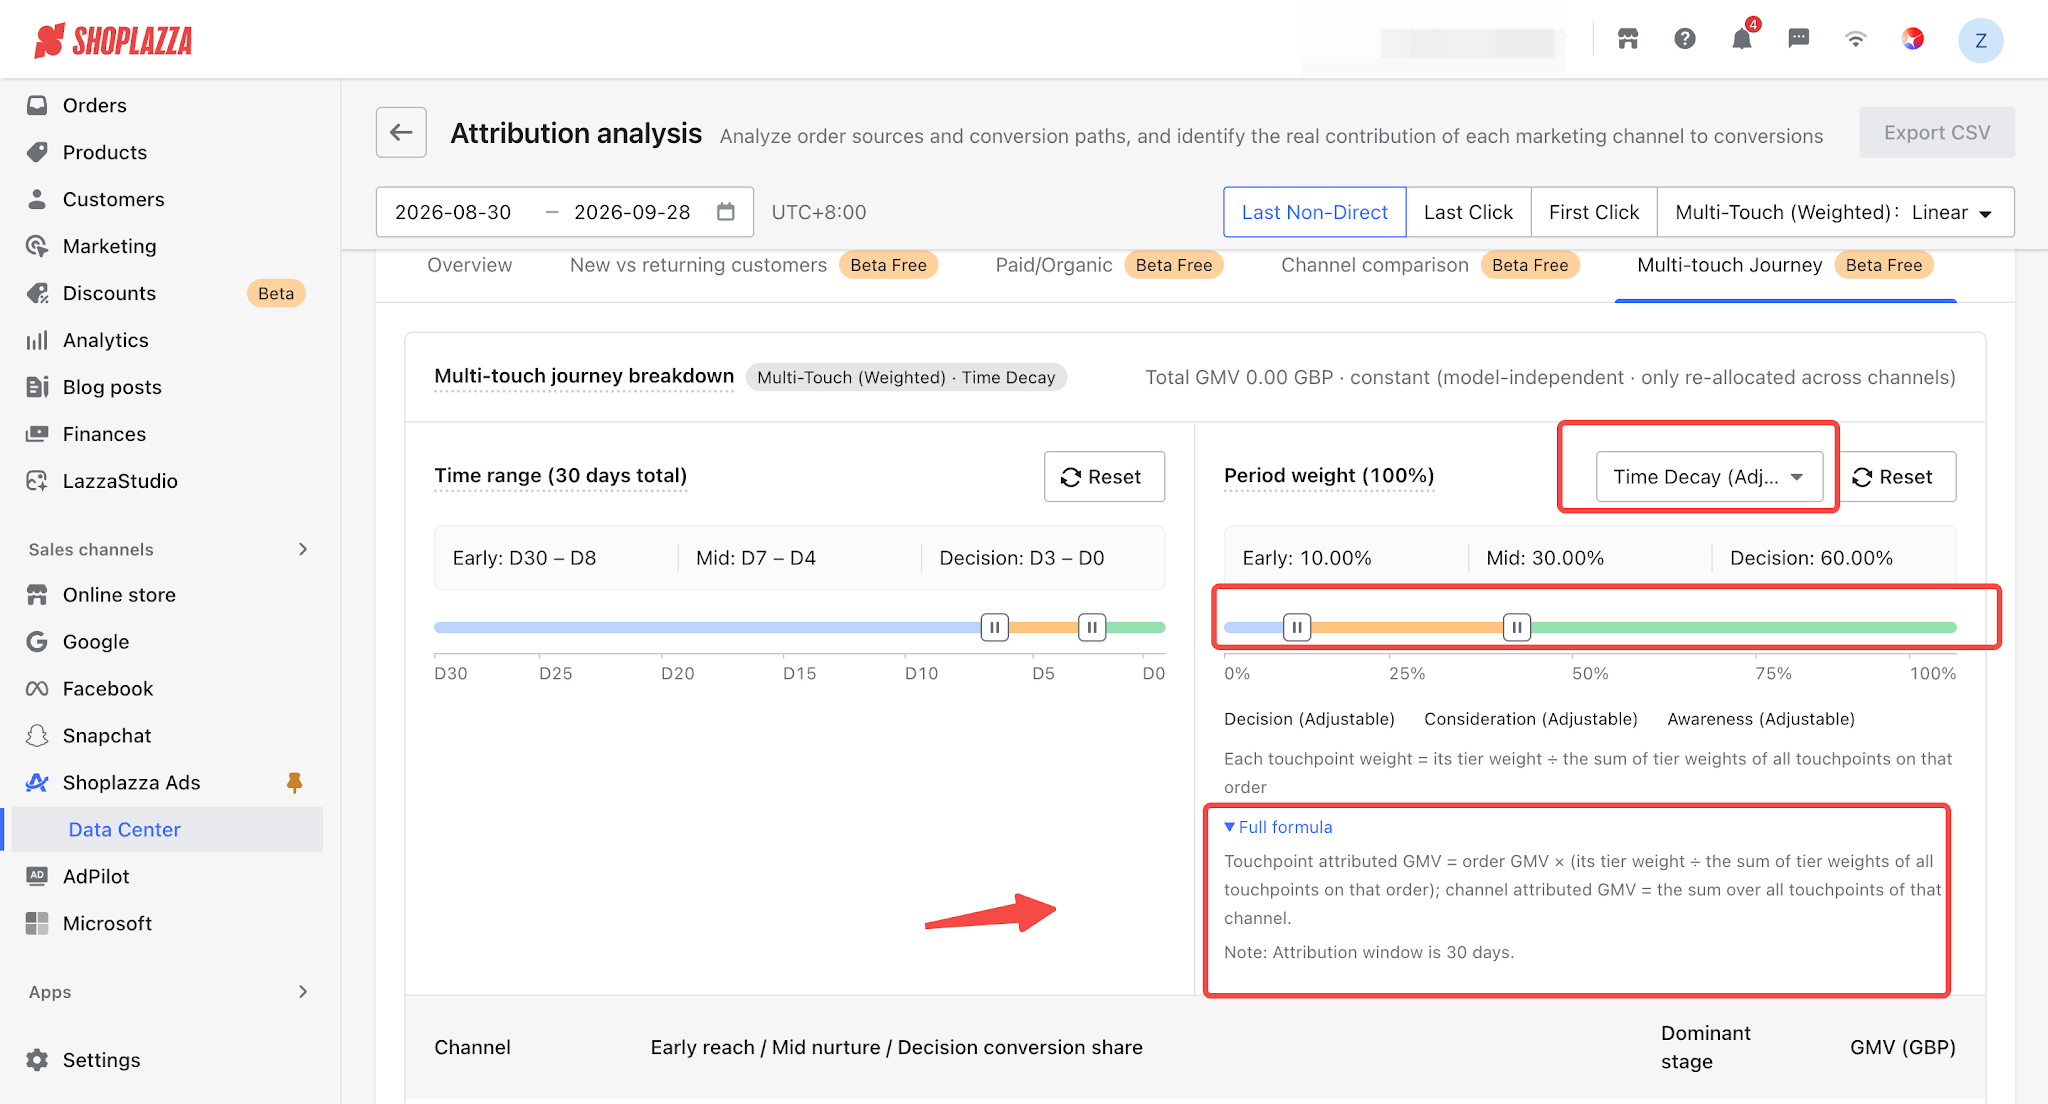
- Weight Settings — Adjustable for Time Decay Only: Only the Time Decay model allows you to dynamically adjust the weights for each stage. The default weights are 0.6 / 0.3 / 0.1 (see Section 5 for the rules and calculation examples). Drag the controls to test different weight distributions. Linear uses equal weights by default, and its weights are locked and cannot be adjusted. The Stage Duration control allows you to adjust the number of days assigned to each of the three stages separately.
- Calculation Details: The formula can be expanded and viewed directly on the page, making it easy to verify the calculations for individual orders.
Ⅲ. How Channel Contribution Is Calculated
The entire attribution process can be summarized in three steps:
1. Record the Customer Journey: Record the customer’s visits within the 30 days before placing an order, including the traffic source, pages visited, visit time, and device used. Each visit to the store is considered a touchpoint.
2. Identify the Traffic Channel: Determine the channel associated with each touchpoint based on identifiers in ad links, UTM parameters, referring websites, and other relevant information.
3. Assign Order Attribution: Allocate the order value to the relevant channels based on the attribution model you select.
Example:
To make the attribution models easier to understand, let’s take an order placed by a customer named Xiaomei as an example.
Xiaomei visited the store 4 times within the 14 days before placing the order and ultimately completed a $200 order:
| Time | Channel | What Happened |
| 14 days ago | Instagram Ads | Discovered your product through an ad and became interested |
| 5 days ago | YouTube Unboxing | Watched a creator’s review and became interested in the product |
| 1 day ago | Google Search | Searched for your brand name and found your website |
| Day of Purchase | Direct | Entered the URL directly to visit the store and placed a $200 order. Looking only at this step, it would be difficult to identify the preceding traffic sources |
Which channel should this $200 order be attributed to? Should it be attributed to Instagram, which brought the customer to the store first, or to YouTube, Google, or the final Direct visit that ultimately led to the purchase?
This is exactly what an attribution model is designed to address: based on the customer’s complete visit journey before placing the order, it determines each channel’s contribution to the order according to different attribution rules.
Ⅳ . How to Choose an Attribution Model
Attribution models answer the same question: Which channels should this order be attributed to?
Different models use different attribution methods, and there is no universally right or wrong approach. Each model is suited to different business scenarios. Using Xiaomei’s order above as an example, the following section compares the attribution results under different models to help you understand the differences more intuitively.
| Model | How Credit Is Assigned | Attribution for Xiaomei’s Order | When to Use It |
| Last Non-Direct Click (Default) | Gives all the credit to the last channel that genuinely brought the customer to the store. If the final step is a direct visit, a return from the payment page, or a backend operation, the system automatically looks back to the previous valid traffic source. | Google: The final step was a direct visit, so the system looks back to the Google Search visit. | Use this for everyday analysis of which channels are actually driving conversions. |
| Last Click (Including Direct) | Gives all the credit to the most recent touchpoint, including direct visits. | Direct: She entered the URL directly before placing the order. | Use this when you want to see the final touchpoint as it actually occurred and understand the share of direct traffic. |
| First Click | Gives all the credit to the first source that brought the customer to the store. | Instagram: The journey started with that ad. | Use this to understand which channels are driving new customers and creating initial interest. |
| Linear | Splits the credit equally across all visits within 30 days. | Four visits receive 25% each, so each channel gets $50. | Use this to understand which channels contributed throughout the entire customer journey. |
| Time Decay | Gives more credit to visits that occurred closer to the purchase. | More recent visits receive more credit. See Section 5 for the full calculation. | Use this to understand which channels played a greater role in driving the final conversion. |
Tips
Use First Click to evaluate customer acquisition; use Last Non-Direct Click (default) to analyze actual channel conversions and reconcile results with advertising platforms; use Last Click to accurately reflect the final touchpoint; and use Linear / Time Decay as a reference when adjusting budget allocation.
Ⅴ. How Multi-Touch Attribution Models Allocate Credit (Verification Guide)
Linear and Time Decay are multi-touch attribution models. Instead of assigning all the credit to a single visit, they distribute credit across all touchpoints in the customer journey based on different weights. If you’d like to understand the calculation process in more detail, you can use the formulas below to verify the results yourself.
Weighting Rules
- Linear: Each visit within the 30-day period receives the same weight, and the credit is distributed equally. The weights are fixed and cannot be adjusted.
- Time Decay: Visits are divided into three time periods based on how many days before the order they occurred, with visits closer to the purchase receiving a higher weight. The table below shows the default weights. Of the two multi-touch attribution models, only Time Decay allows you to adjust the weights and test different scenarios in the Multi-Touchpoint Journey Breakdown tab.
| Stage | Days Before Purchase | Default Weight |
| Decision & Conversion | 0–3 days | 0.6 |
| Mid-Stage Awareness | 4–7 days | 0.3 |
| Early Touchpoints | 8–30 days | 0.1 |
| (Not Applicable) | More than 30 days | Outside the reporting range; not displayed, with a weight of 0 |
Calculation Formula
Touchpoint Attributed GMV = Order GMV × (Weight of the touchpoint’s stage ÷ Total weight of all touchpoints in the order)
Channel Attributed GMV = Sum of all touchpoints attributed to that channel.
Let’s use Xiaomei’s order above to verify the calculation:
For the $200 order with four visits:
- Instagram (14 days before purchase, Early Touchpoints, weight 0.1)
- YouTube (5 days before purchase, Mid-Stage Awareness, weight 0.3)
- Google (1 day before purchase, Decision & Conversion, weight 0.6)
- Direct (day of purchase, Decision & Conversion, weight 0.6)
Under the Time Decay model:
- Total weight = 0.1 + 0.3 + 0.6 + 0.6 = 1.6
- Google receives $200 × 0.6 ÷ 1.6 = $75.00; Direct receives the same, $75.00
- YouTube receives $200 × 0.3 ÷ 1.6 = $37.50; Instagram receives $200 × 0.1 ÷ 1.6 = $12.50
- The four amounts add up exactly to $200, so the full order value is allocated without over- or under-attribution.
If you switch to the Linear model, the four visits are weighted equally, so each channel receives $50.
Note
Multi-touch attribution models do not exclude any touchpoints: all visits in the customer journey are included in the attribution calculation, including visits from payment-page redirects and store backend operations. Therefore, it is normal and not an error to see these touchpoints in the journey map.
Only the Last Non-Direct Click model automatically skips non-source visits such as payment-page redirects and backend operations, and continues looking for the earliest valid traffic source.
Ⅵ. Quick Reference: Data Definitions
Before recording, reporting, or troubleshooting data discrepancies, we recommend reviewing the table below:
| Frequently Asked Question | Rule |
| How far back are visits included? | Only visits made within 30 days before the order are included. Visits older than 30 days are not included in attribution and are not displayed. |
| Is the data real-time? | No. Data synchronization involves a delay of several hours and subsequent recalculation, so data for the current day may appear gradually and may be incomplete. Considering the various processing delays, we recommend reviewing data on a T+1 basis. Data from the past two or three days may still be backfilled, so it is recommended to avoid using this data for comparisons. |
| How long a period can I query at once? | To ensure query performance, you can query a maximum of 30 days of data at a time. |
| Which time zone is used? | Dates on the page, order times, and exported data all use the store’s time zone, which is displayed in the interface. When reconciling data with an advertising platform, first confirm the time zone used in its reports. |
| What does the attributed amount represent? | The attributed amount is a reference value used for channel allocation to help you assess how much budget each channel may warrant. It is not financial revenue. For financial reconciliation, please refer to the orders in the admin panel. |
| Which orders are included? | All successfully placed orders, regardless of status, are included, including unpaid, canceled, and refund-in-progress orders. Before comparing this data with the Paid Orders count in the admin panel, first filter the data by order status. |
| How are new and returning customers identified? | They are determined based on the date of the customer’s first-ever order, regardless of the selected reporting period. This also allows returning customers to be identified accurately. |
| Can I drill down to a specific ad? | Yes. First configure UTM parameters in your ad links. Once configured, you can drill down to the campaign, ad set, and creative levels. However, this only applies to new traffic after the configuration; historical data will not be backfilled. |
| Will the numbers change when I switch attribution models? | Only how the value is allocated across channels will change. The total number of orders and total sales remain unchanged across all attribution models. |
Ⅶ. Why Don't Attribution Analysis and Advertising Platform Data Match?
Differences between advertising platform data and Attribution Analysis are normal and do not necessarily mean that either source contains incorrect data. Advertising platforms and Attribution Analysis use different reporting metrics, attribution rules, and data time ranges. As a result, the same order may be attributed differently across reports. Common reasons include the following:
| Reason | Explanation |
| The platform also attributes conversions from ad impressions without clicks | Advertising platforms may attribute orders to ads that customers saw but did not click, such as customers who saw an ad, later visited the store directly, and made a purchase. This is known as view-through attribution. This report only recognizes tracking signals left by ad clicks, so it cannot capture these conversions. This is the most common reason. |
| Each platform uses independent attribution without unified deduplication | The same order may be claimed by multiple platforms at the same time, so the combined total can naturally exceed the actual number of orders. |
| Different reporting dates | Advertising platforms typically attribute conversions to the date the ad was clicked, while this report attributes them to the order date. It is normal for the numbers to differ on a single day but align more closely when compared over a longer period. |
| Different time zones | When the advertising account’s time zone differs from the store’s time zone, orders placed around midnight may be recorded under different dates. |
| Data delays | Recent orders or ad conversions may still be undergoing data synchronization or recalculation. It is recommended not to determine whether the two data sources match based solely on the most recent few days. |
| Different metrics are being compared | Metrics such as Conversions or Purchases on advertising platforms may use different definitions from the store’s Total Orders. They should not be compared directly on a one-to-one basis. |
Reconciliation Recommendations
1. In the advertising platform’s dashboard, break down conversions into click-through conversions and view-through conversions, and compare only the click-through conversions with this report.
2. Switch the attribution model to Last Non-Direct Click (default) before reconciling the data.
3. Compare data over a continuous period of at least 7 days, rather than comparing individual days.
4. First confirm that both reports use the same time zone.
Ⅷ.Frequently Asked Questions
Q1: The advertising platform says it brought in 20 orders, but the report shows only 12. Which one is correct?
Neither is necessarily wrong. The difference comes from the attribution methods used by the two systems. By default, advertising platforms may also attribute orders to ads that customers saw but did not click before later visiting the store and making a purchase, while this report only recognizes click-based traffic.
We recommend breaking down the conversions in the advertising platform’s dashboard into click-through conversions and view-through conversions, and comparing only the click-through conversions with this report. This will usually narrow the gap significantly. For any remaining differences, refer to the six possible reasons in Section 7 and check them one by one.
Q2: This order was clearly driven by an ad. Why is it showing as Direct?
First, check which attribution model you are currently using. The Last Click model faithfully records the final touchpoint: if the customer entered the store by typing the URL directly, the order will be attributed to Direct. Switch to the default Last Non-Direct Click model, and the system will automatically look back for the most recent valid traffic source.
If the order is still attributed to Direct under the default model, it means none of the customer’s visits within the past 30 days carried a channel identifier. A common reason is that an intermediate redirect in the ad link caused the tracking parameters to be lost. You can open the order in Order Journey and review each visit record and landing page URL to verify the traffic source.
Q3: I’m running ads on several platforms at the same time. Why was this order attributed to a different platform?
When advertising across multiple platforms, customers may interact with several platforms before making a purchase. Just like Xiaomei’s order, the customer may have interacted with Instagram, YouTube, and Google. Under the default model, the credit goes to the last valid channel that brought the customer to the store — in this case, Google. The fact that Instagram receives no attribution does not mean the attribution is incorrect.
To analyze each platform’s contribution to customer acquisition, switch to First Click. To understand the contribution of all channels throughout the customer journey, use Linear. Comparing these different perspectives provides a more complete view.
Q4: Why are so many orders attributed to Direct?
A high proportion of Direct traffic is not necessarily a problem. Returning customers may visit the store directly, use a bookmark, or manually enter the URL, all of which can be recorded as Direct traffic. Stores with a higher proportion of returning customers naturally tend to have a higher share of Direct traffic.
The default Last Non-Direct Click model already looks back for a valid traffic source. If the Direct share still appears unusually high, we recommend checking whether the landing page URLs used across your advertising channels consistently include the required UTM parameters.
Q5: Why do the numbers change when I switch attribution models? Which one is correct?
All of the models are valid. The attribution model does not change the underlying facts: the number of orders and total sales remain exactly the same under every model. What changes is how the contribution is allocated across channels.
It is like a goal in a soccer match: you can attribute it to the player who took the final shot (Last Click), the player who initiated the attack (First Click), or distribute the credit across the entire team (Linear).
Choose the model based on the question you want to answer: use First Click to analyze customer acquisition, Last Non-Direct Click to analyze conversions, and Linear / Time Decay as a reference for budget allocation.
Q6: Why doesn’t the amount in the report match my financial revenue?
The amount shown in the attribution report is a reference value for channel allocation, helping you assess how much budget to allocate to each channel. It does not use the same definition as financial revenue — for example, it may include unpaid orders and does not deduct refunds.
For financial reconciliation, please refer to the orders in the admin panel.
Q7: Can I see exactly which ad generated the order?
Yes, provided that you have properly configured UTM parameters in your ad links. Once configured, the report can drill down to the campaign, ad set, and creative levels.
Note UTM parameters only apply to new traffic after the configuration is in place. Historical orders will not be backfilled. We recommend completing the configuration as early as possible.
Q8: Why can’t I see today’s orders yet?
Data synchronization involves a delay of several hours and subsequent recalculation, so data for the current day may be incomplete. We recommend reviewing data on a T+1 basis, meaning that you should primarily use yesterday’s and earlier data.
In addition, data from the past two or three days may still be undergoing backfill on both sides. When comparing data, we recommend avoiding the most recent three days.


Comments
Please sign in to leave a comment.