
The Product lead analysis report identifies product combinations that were viewed and added to cart by the same customer within the past 7 days. It helps you uncover relationships between products, enabling you to optimize product recommendations, bundle offerings, and marketing strategies for your store.
1. How to Access the Product lead analysis Report
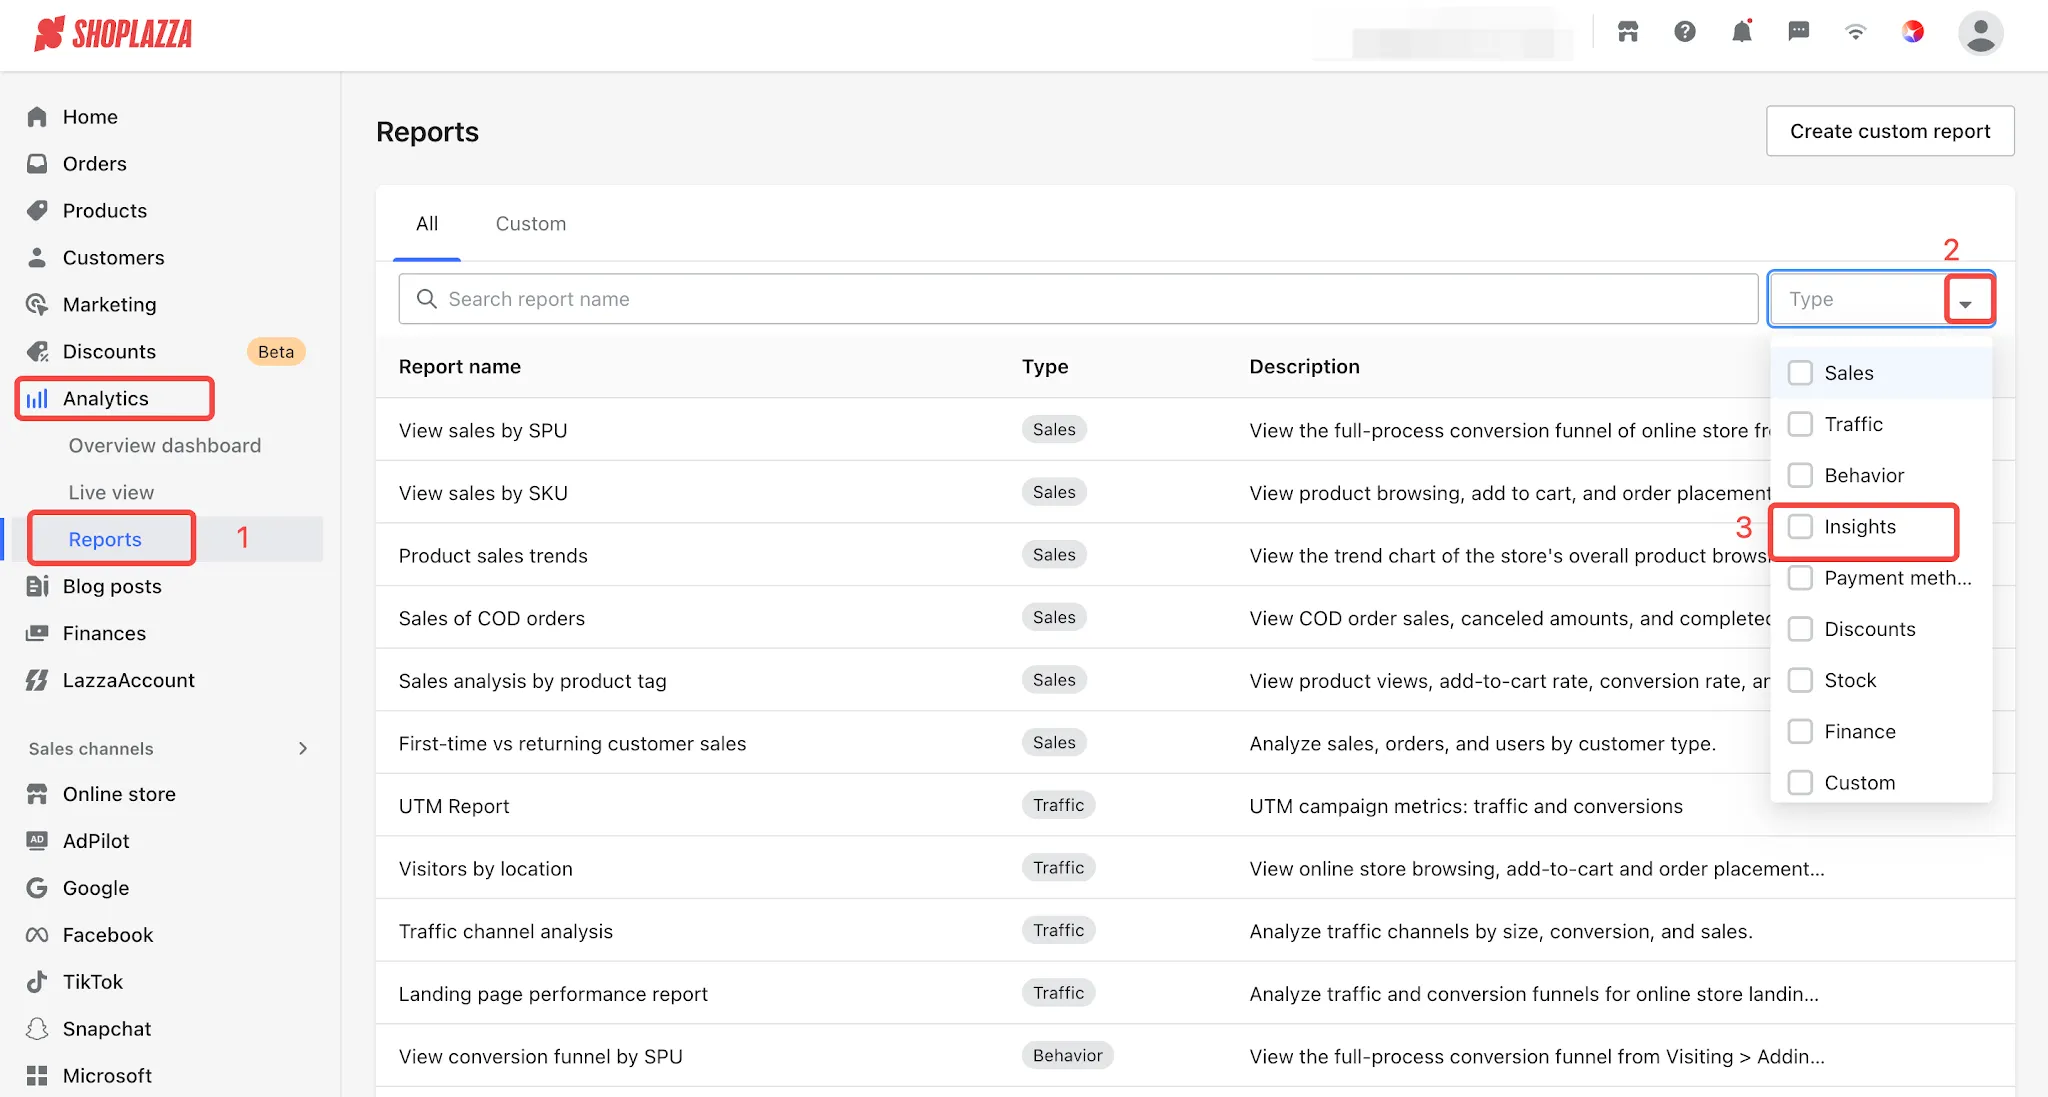
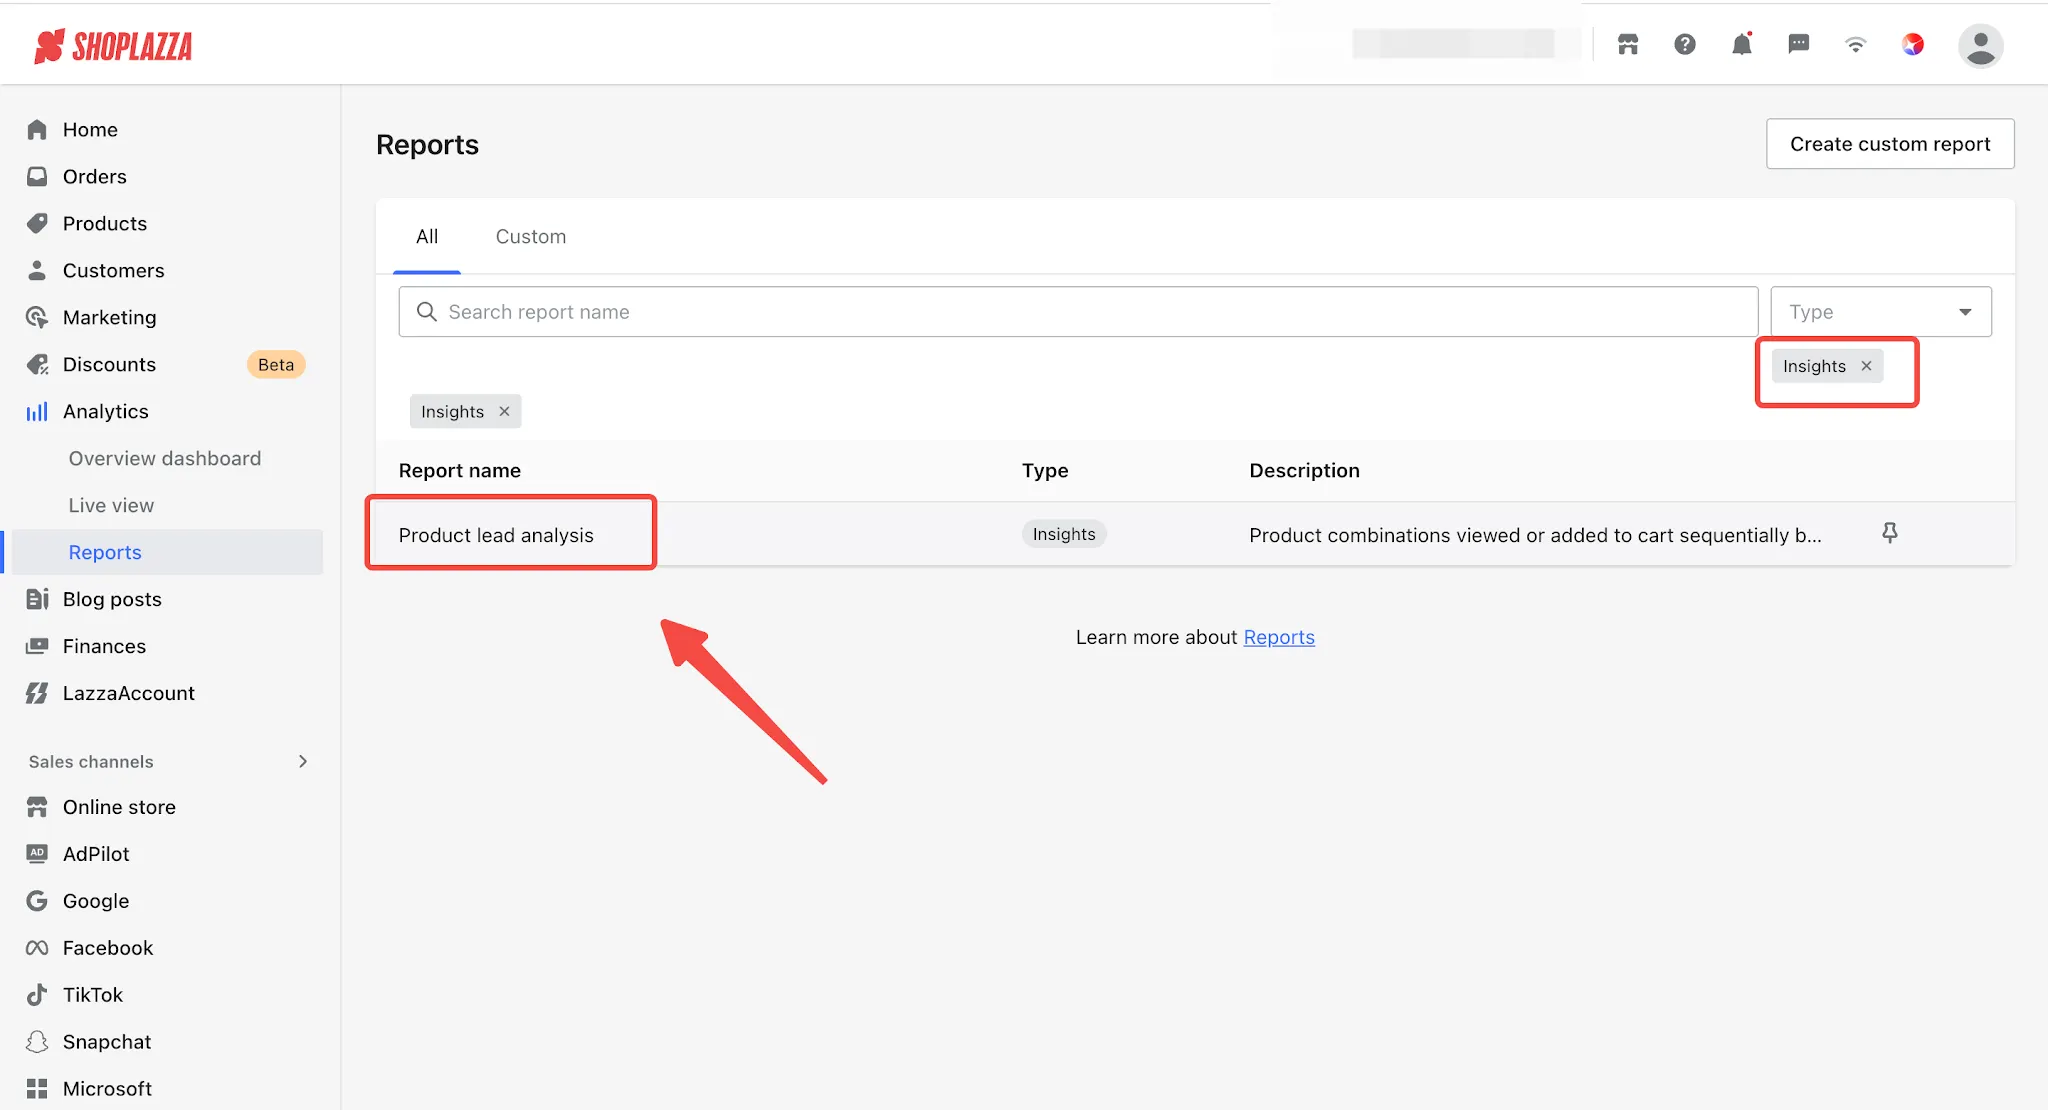
Log in to your Shoplazza Admin, then navigate to Analytics > Reports > Insights > Product lead analysis.
2. Report Features Overview
2.1 Search for Products
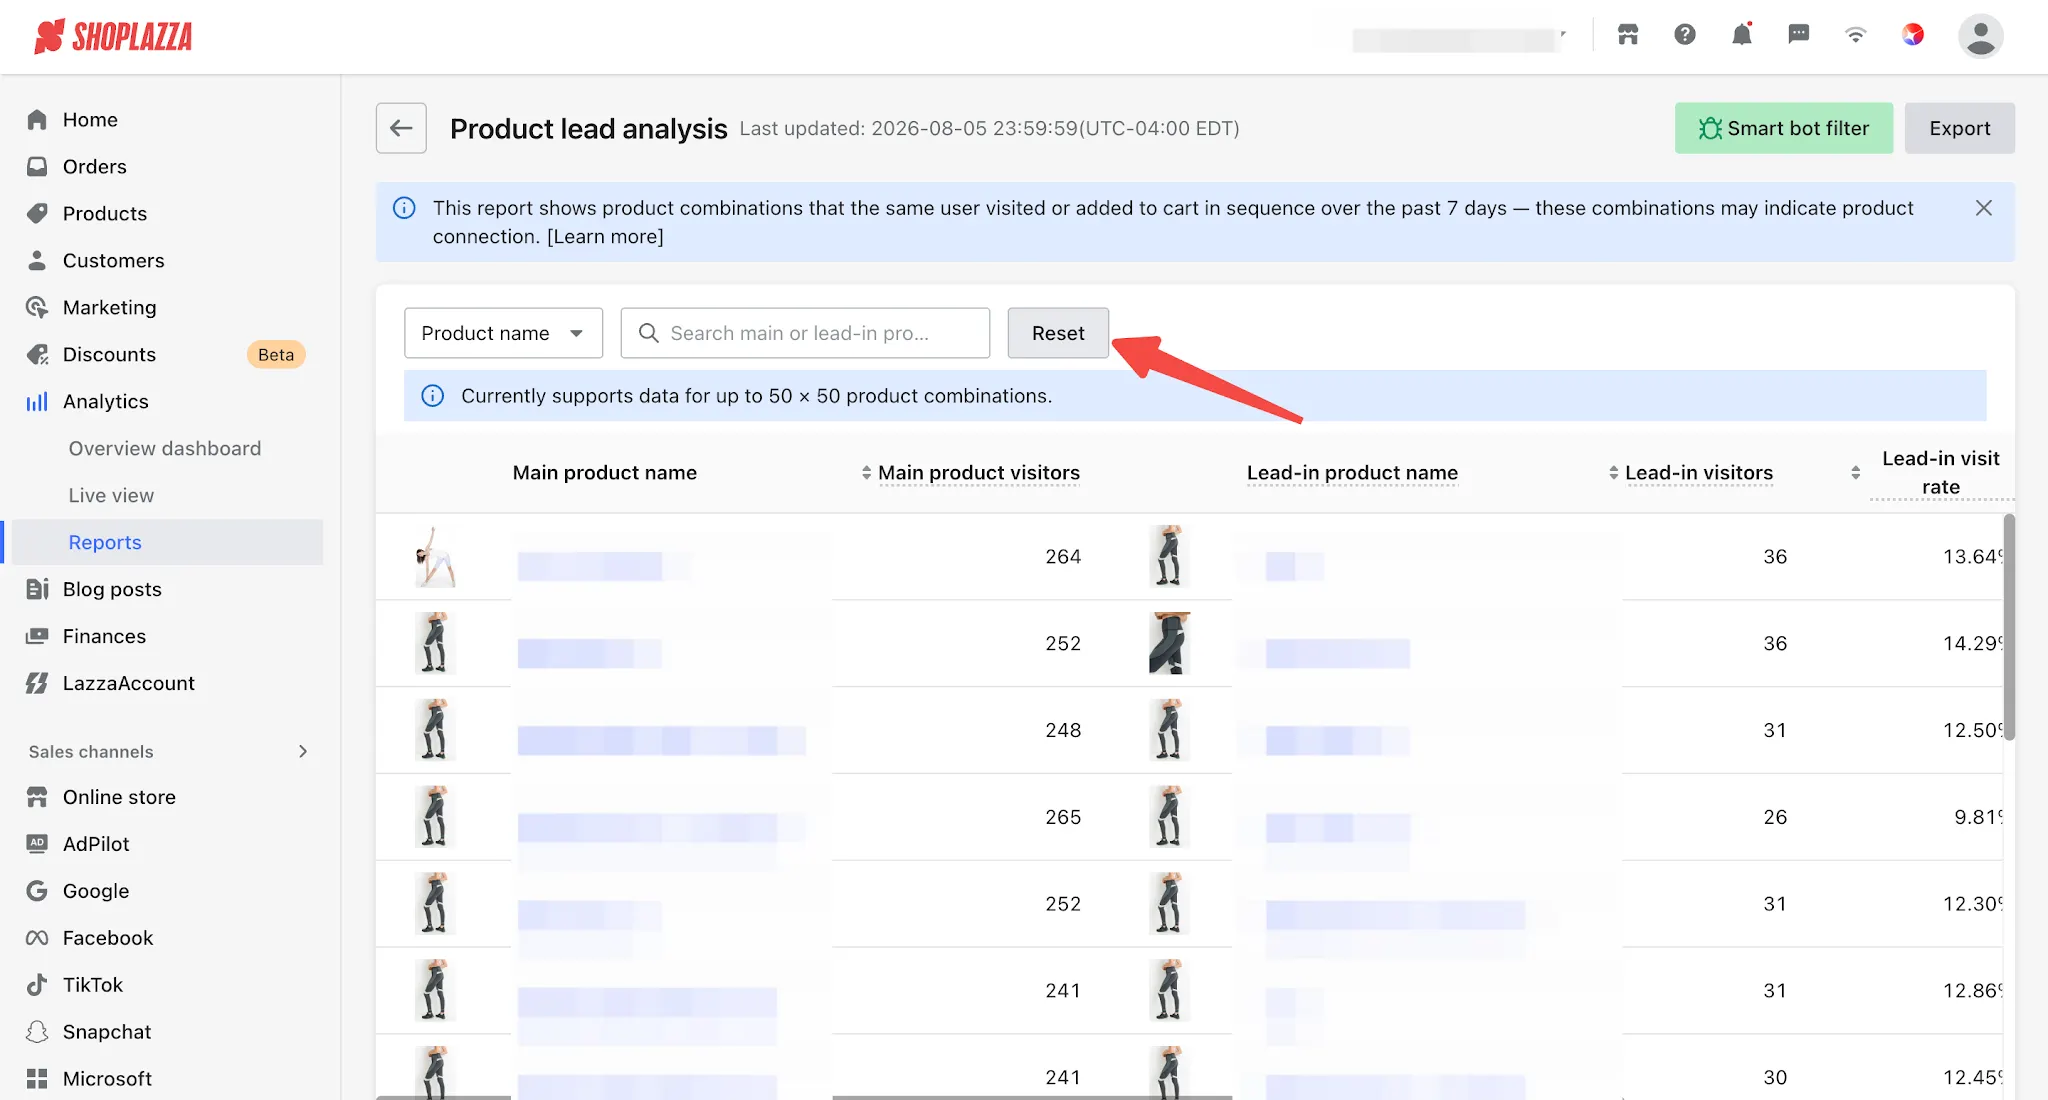
You can use the search function to quickly locate the target product lead analysis data.
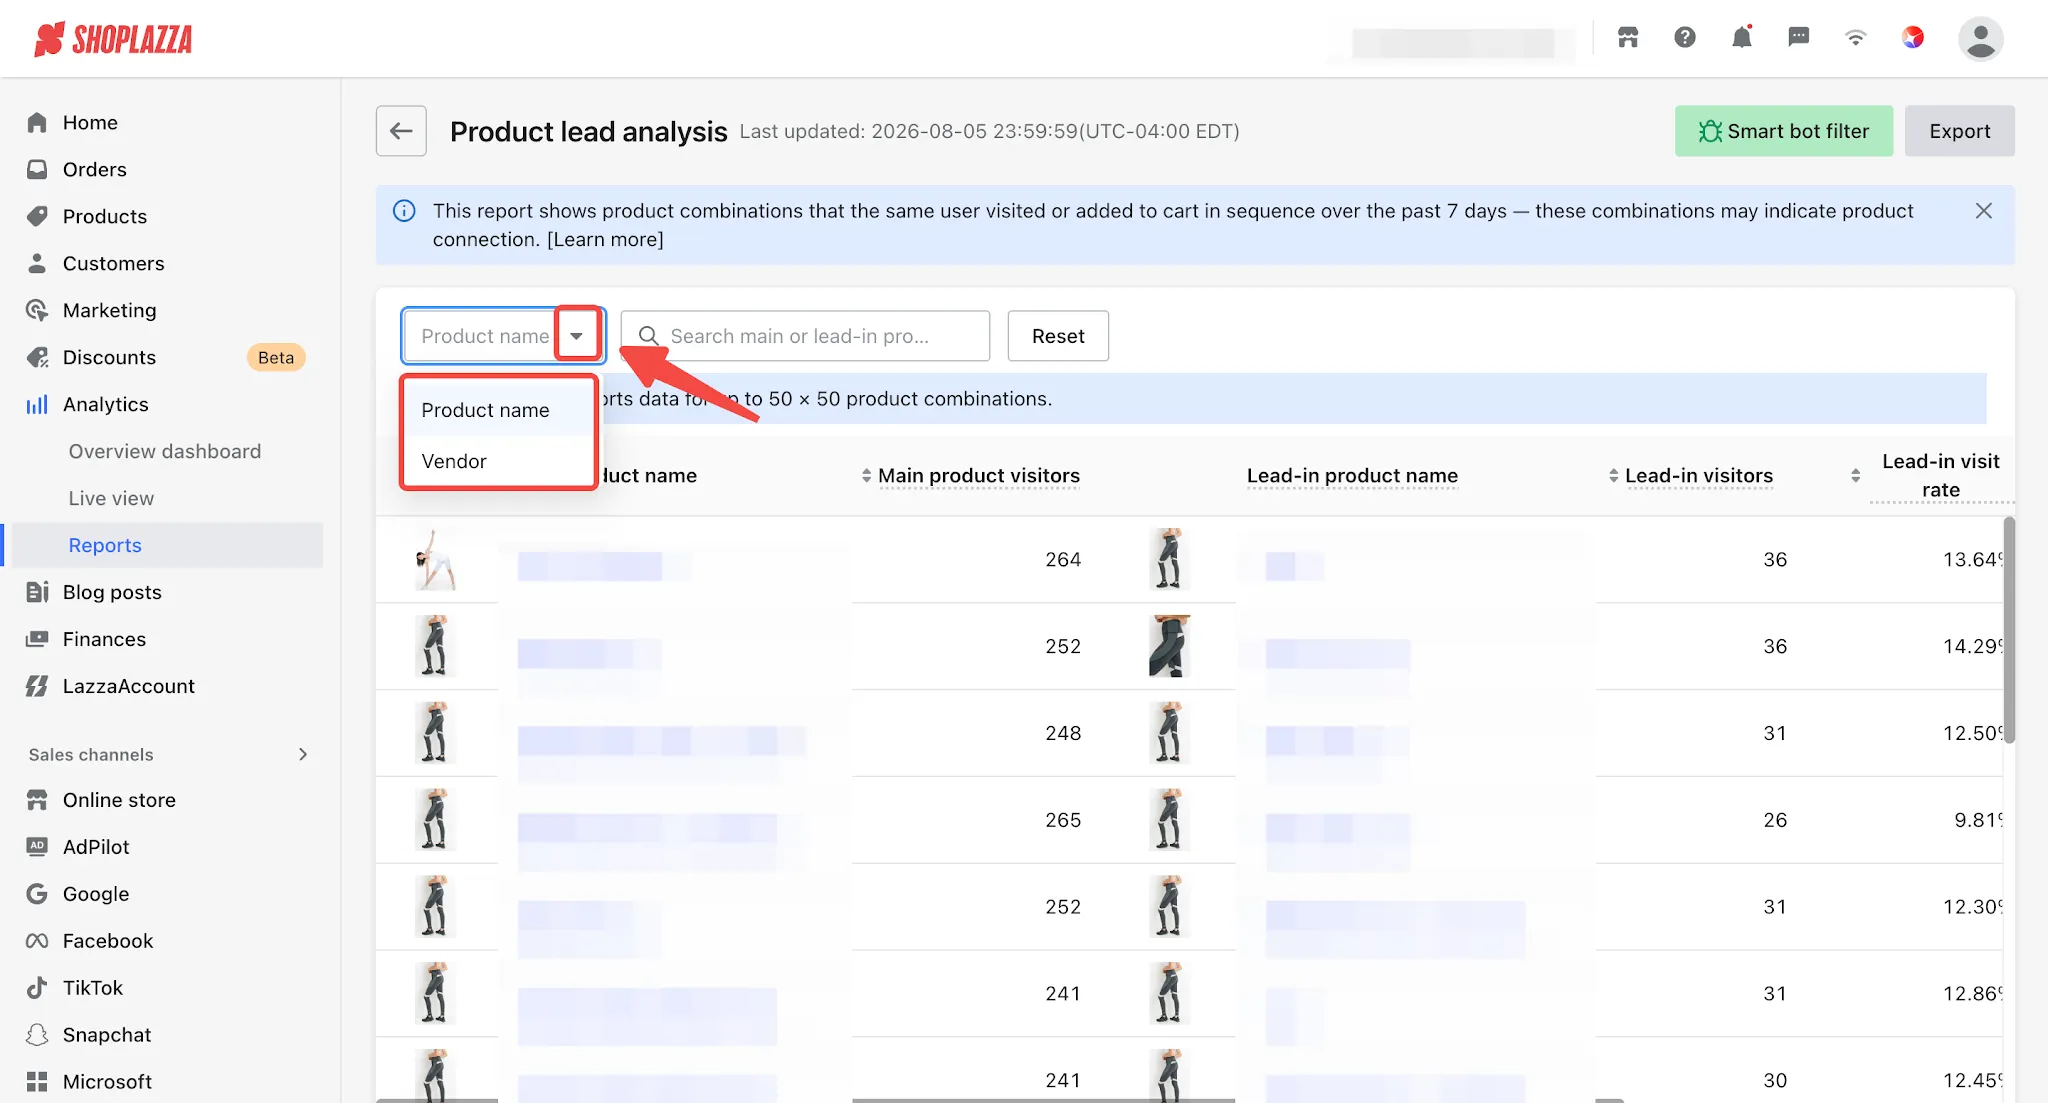
- Click the drop-down menu to the left of the search box and select a search criterion: Product Name or Vendor.
- Enter keywords in the search box, and the system will simultaneously match both the Main products and lead-in products.
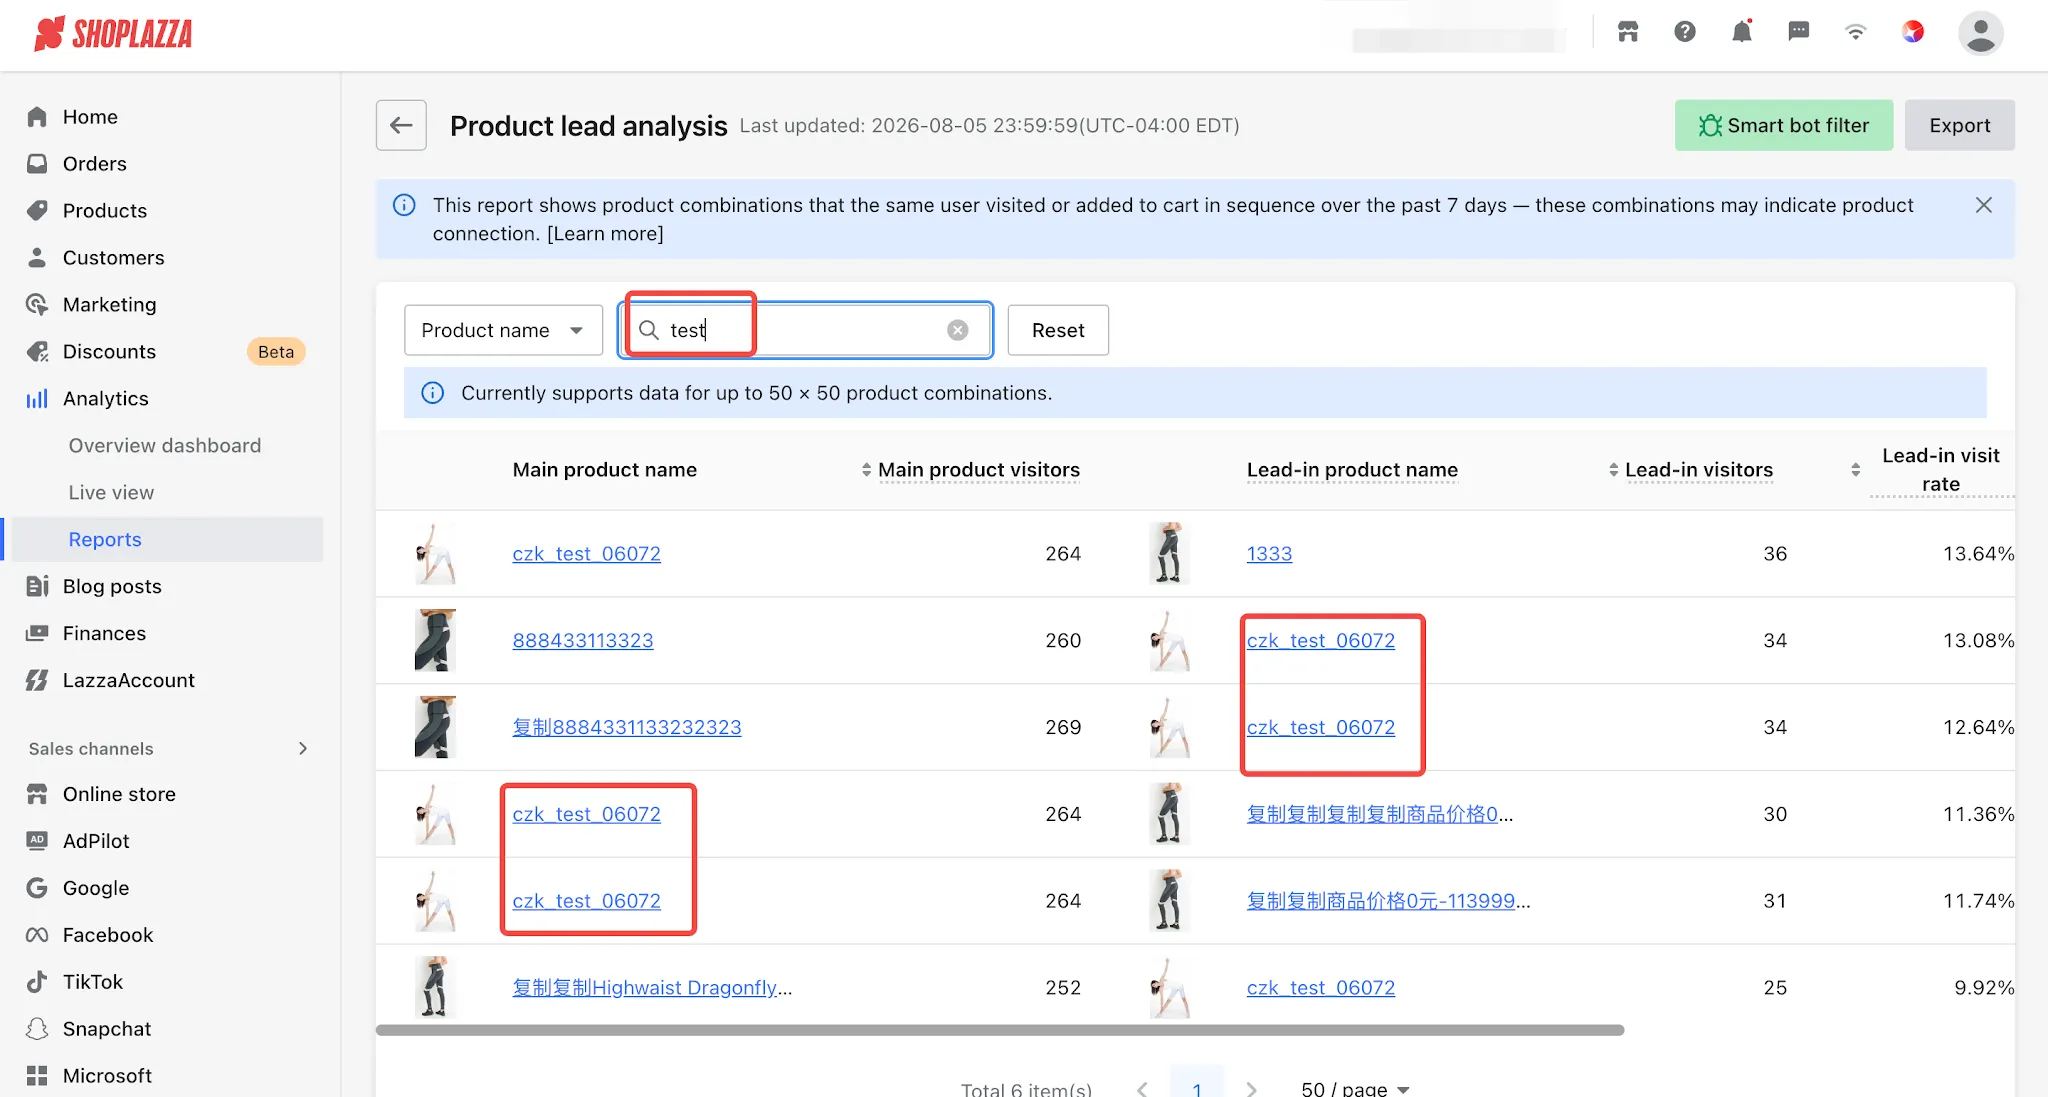
- Click Reset to clear all search criteria and restore the report to its default sorting order.
Note
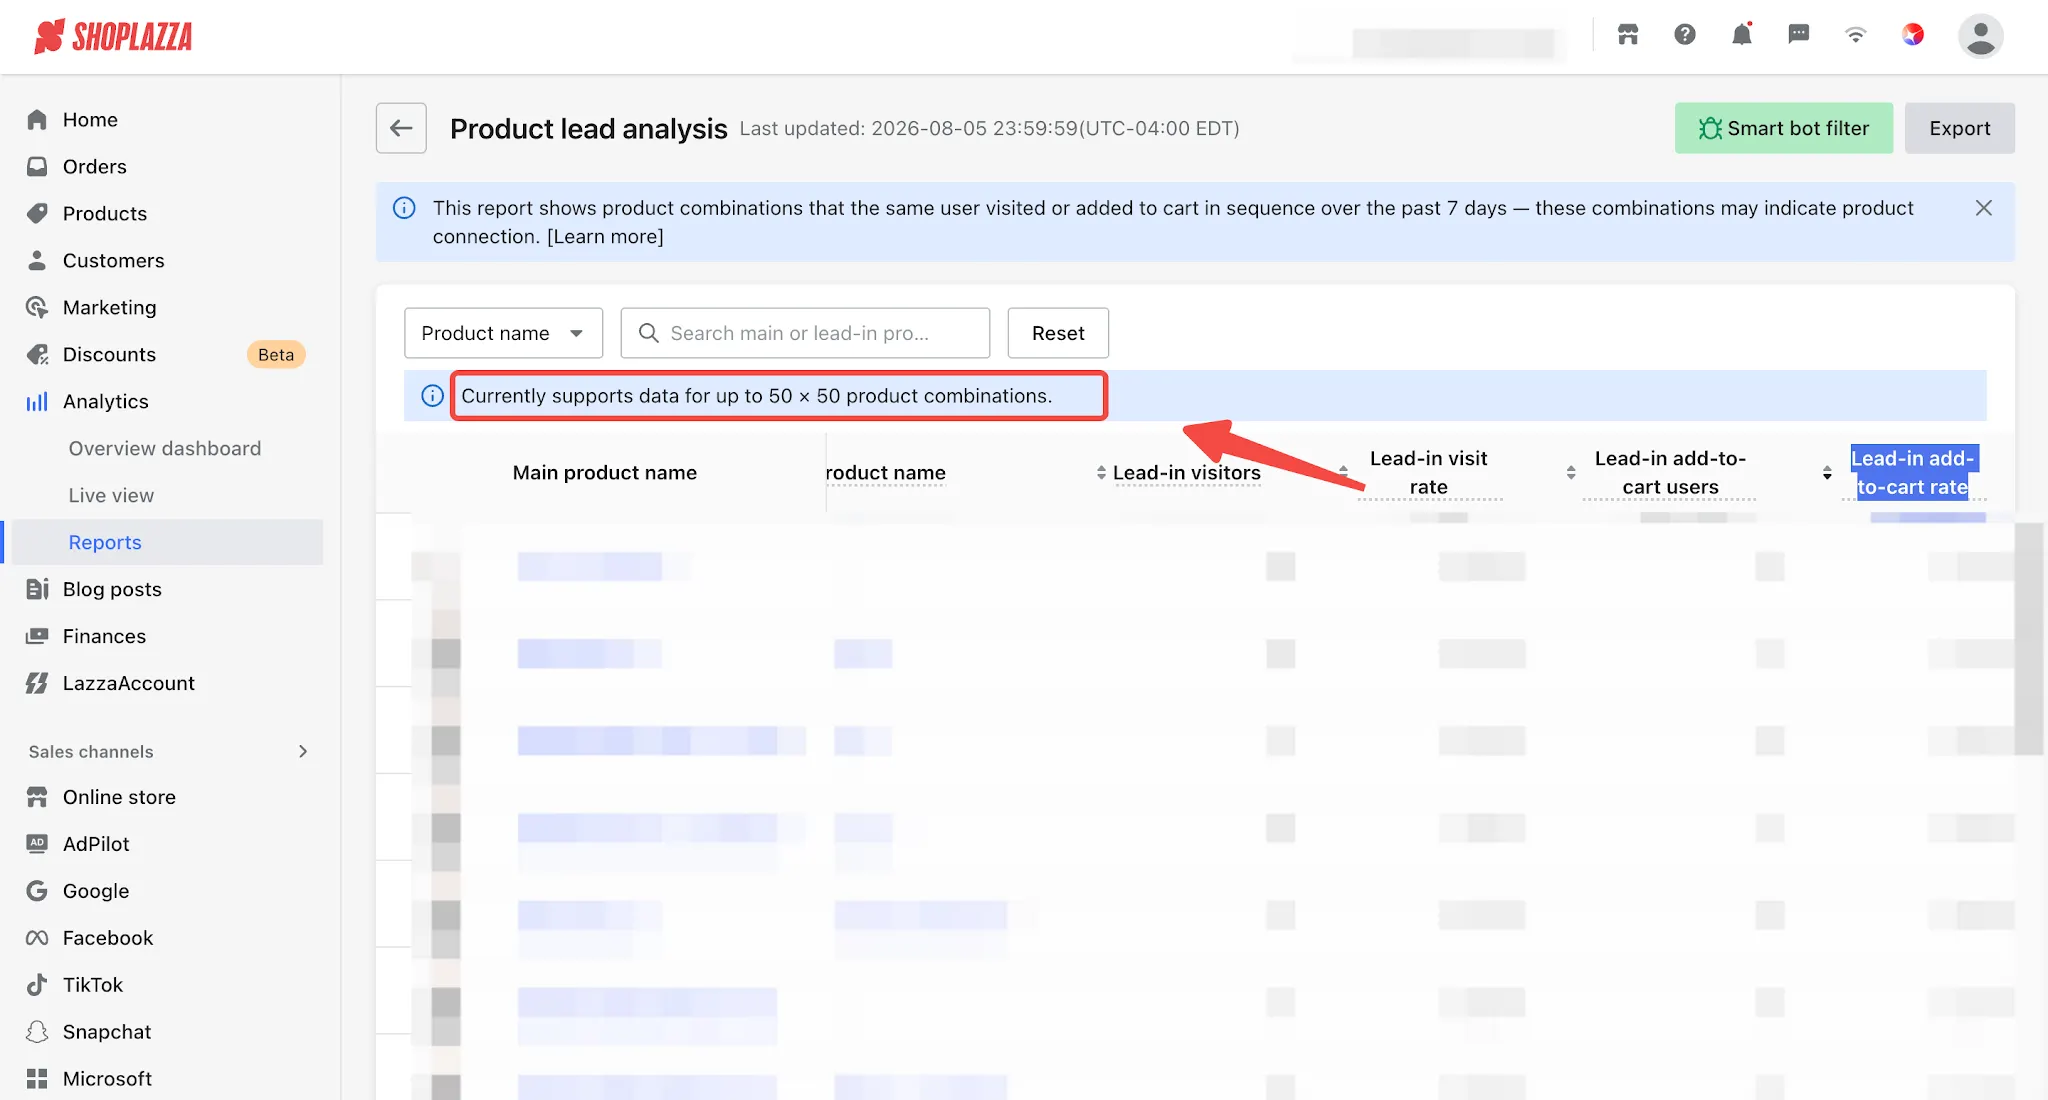
- The report currently displays up to the top 50 main products ranked by the highest number of visiting users, and up to 50 lead products with the highest number of lead visits for each main product, with a total limit of 2,500 lead product combination records. Search is only available within these TOP 50 results and does not support searching lead relationships across all store products.
- Enabling or disabling "Smart Bot Filter " will affect the TOP 50 product rankings and search results.
- After modifying the product name or supplier, the updated values will become searchable after 30 minutes.
2.2 Data Sorting
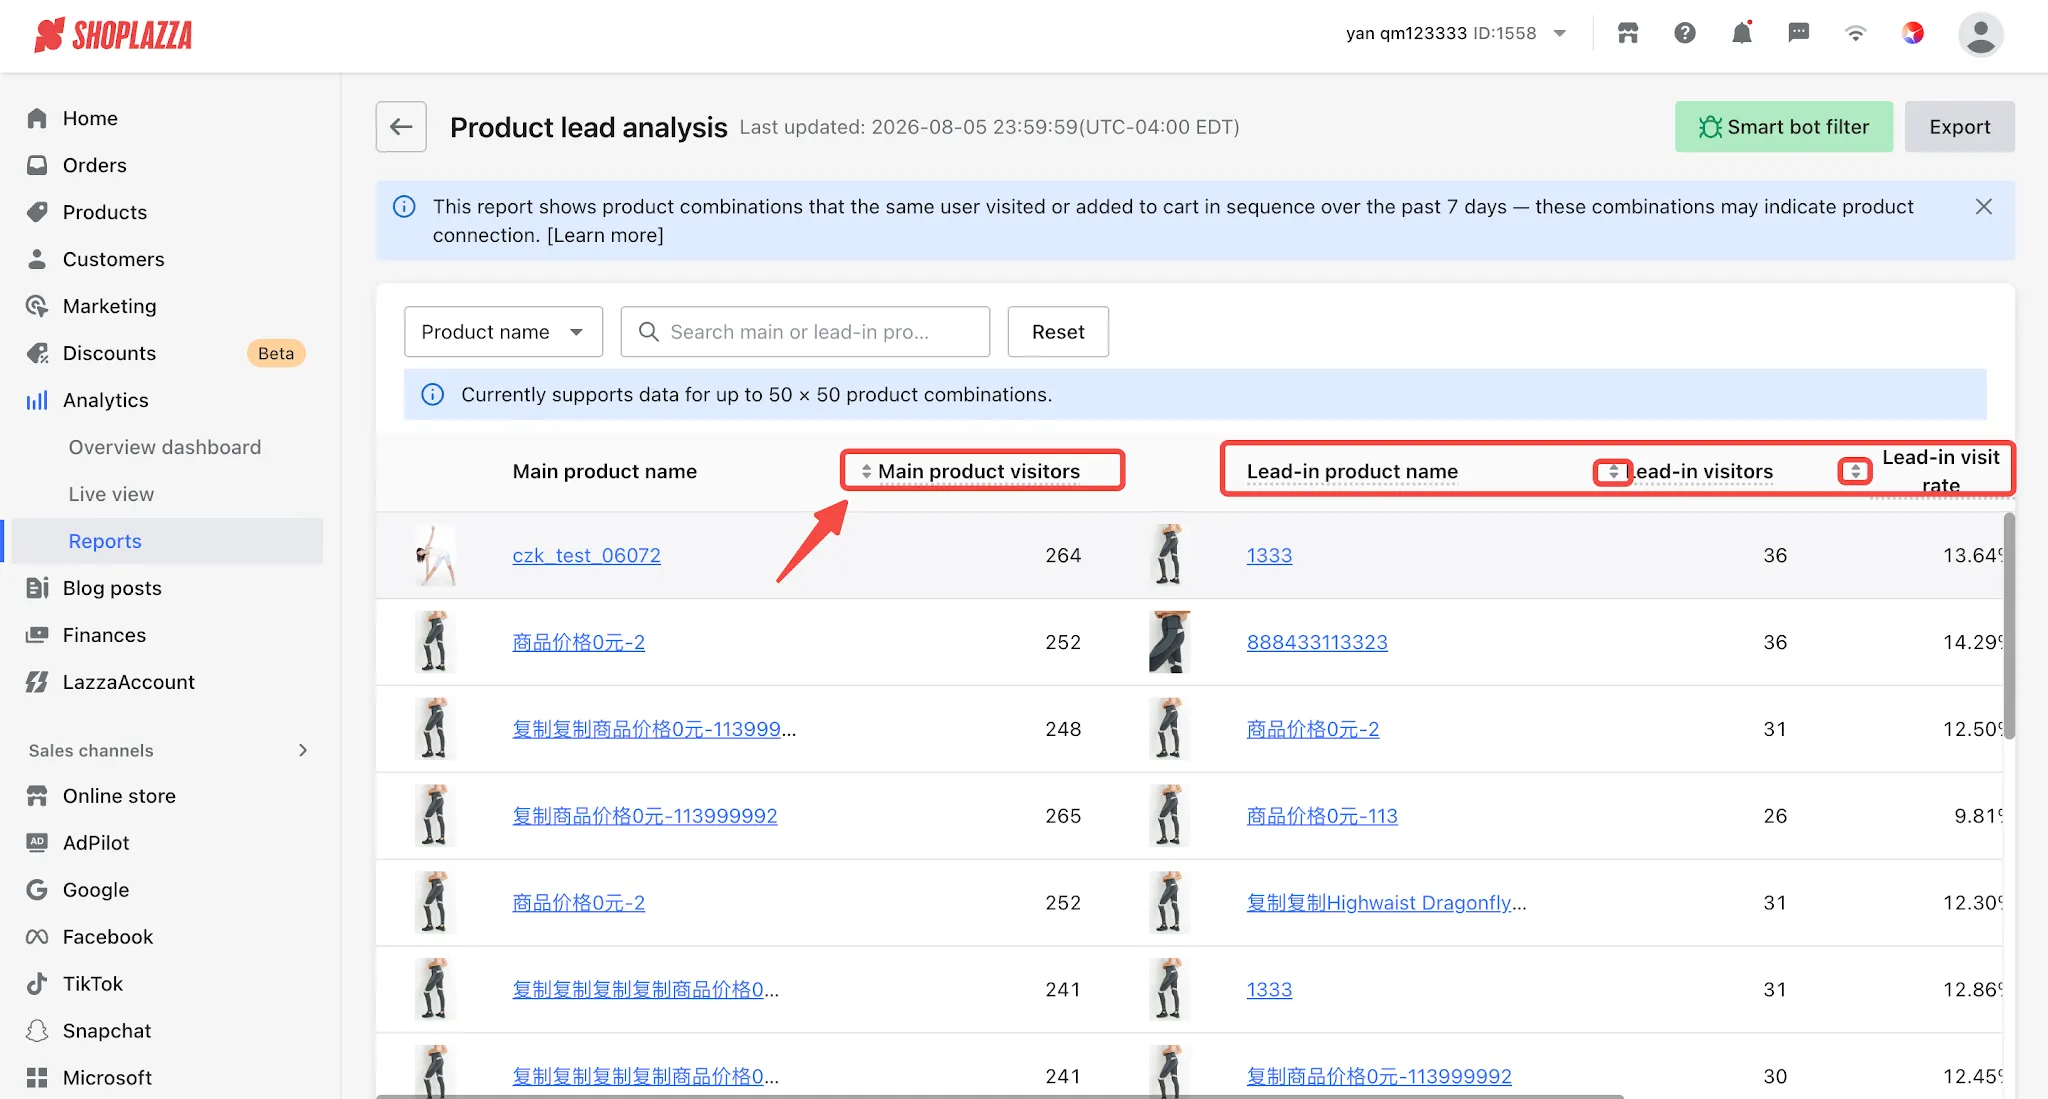
Click the column headers (Main Product Visitors, Lead-in Product Name, Lead-in visitors, Lead-in visit rate, Lead-in add-to-cart users, Lead-in add-to-cart rate) to sort the report data in ascending or descending order. (Image columns do not support sorting.) The report is sorted by lead add-to-cart rate in descending order by default.
2.3 Smart Bot Filter
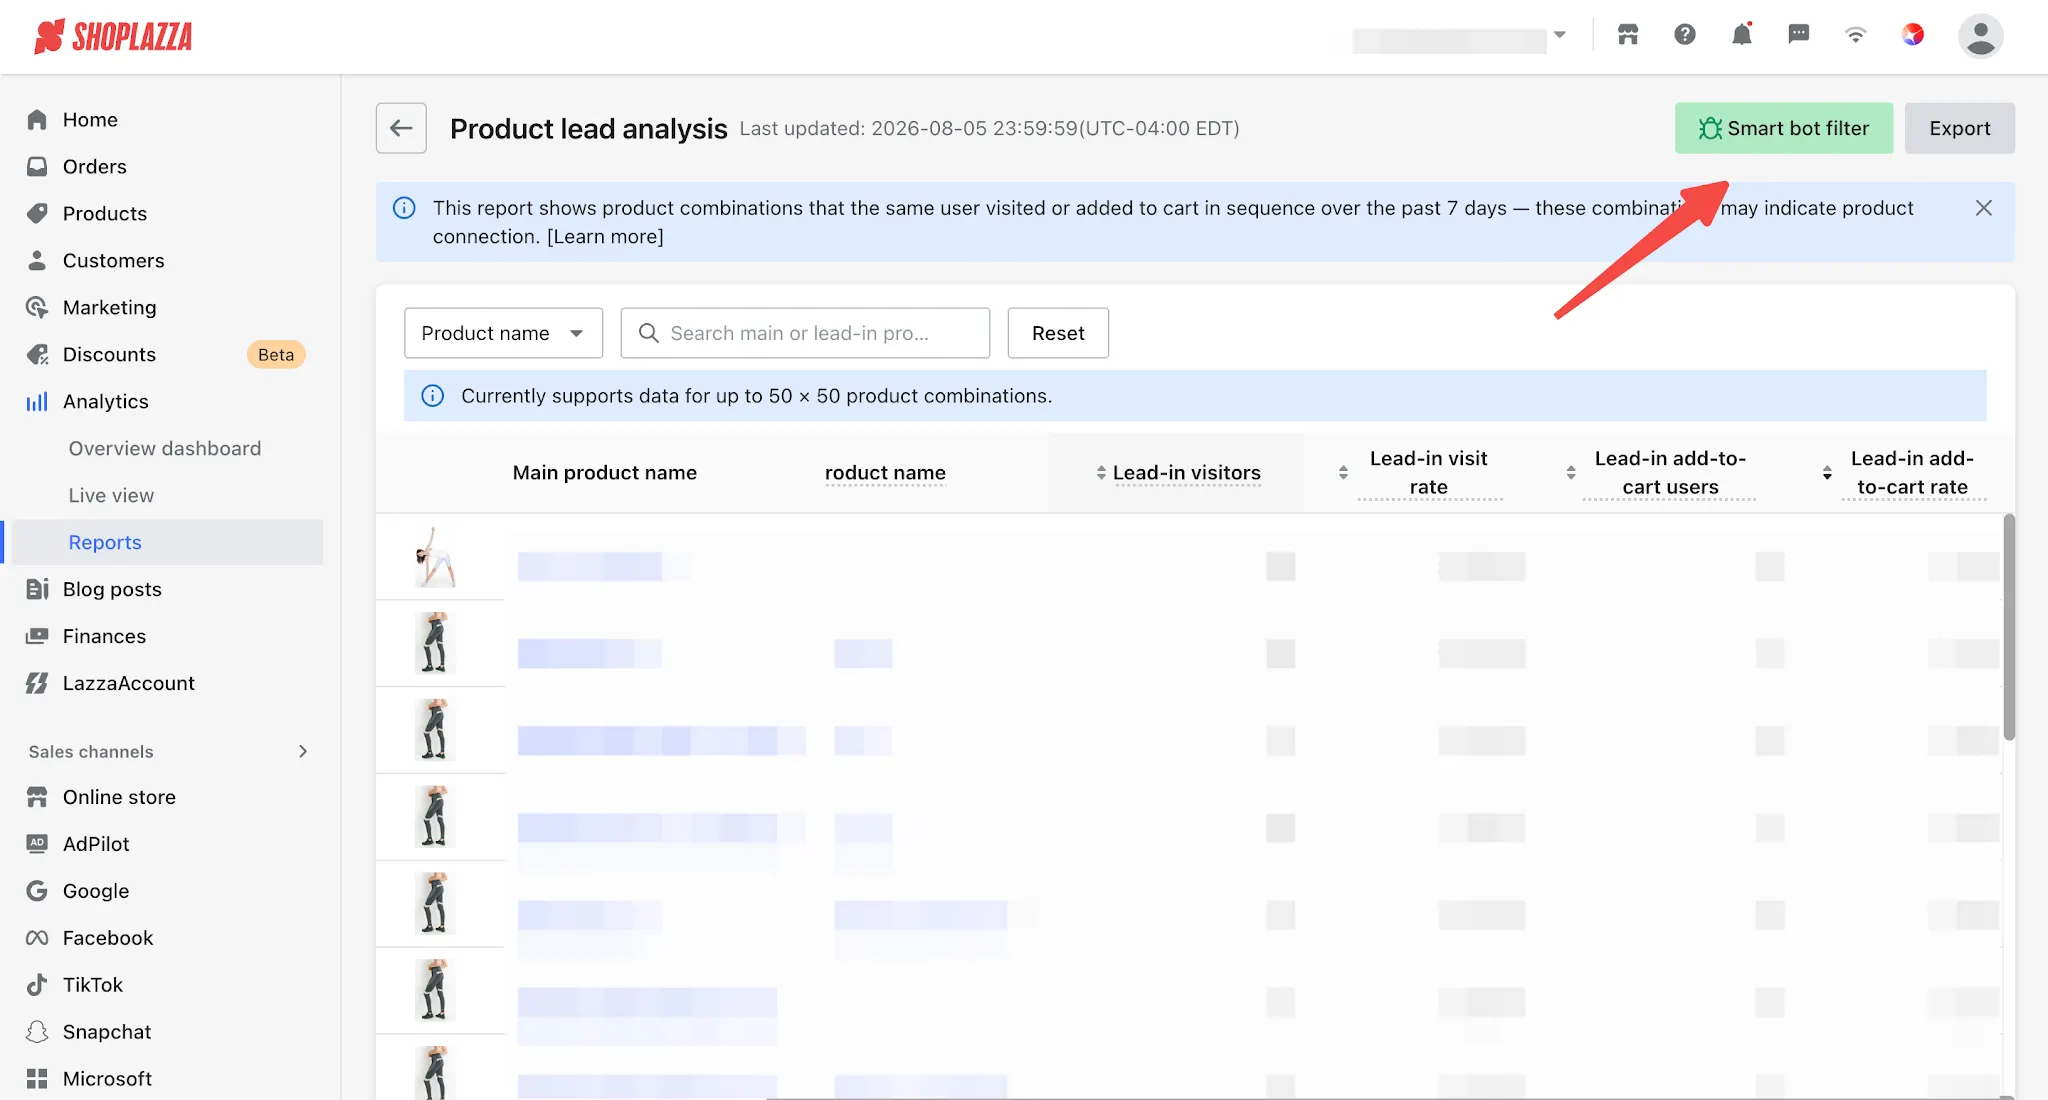
You can enable Smart Bot Filter to prevent bots and crawlers from affecting the report statistics. Once enabled, the report will automatically exclude bot traffic records, making the data more accurately reflect real user behavior.The Smart Bot Filter toggle is available in the top-right corner of the page and is enabled by default.
2.4 Export Data
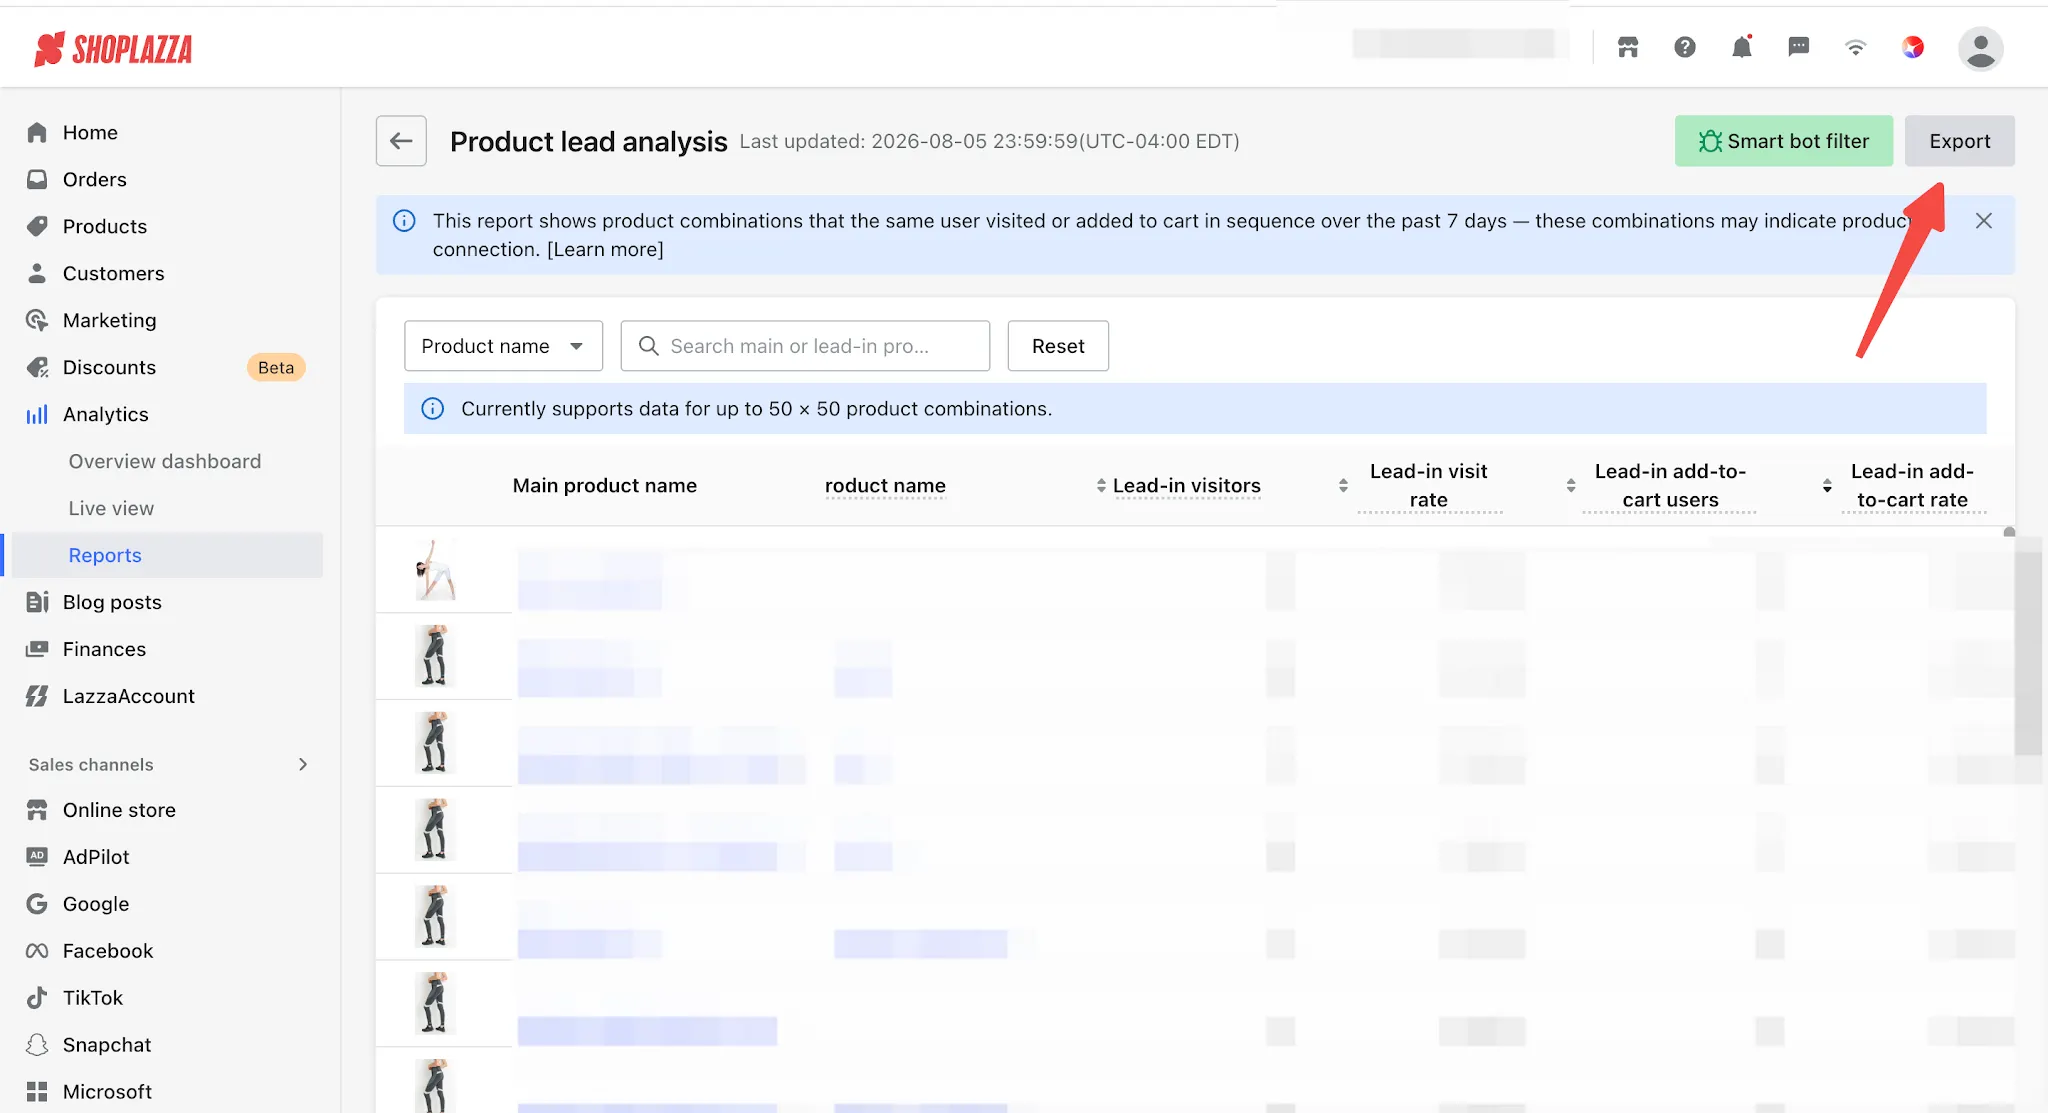
Click Export in the top-right corner of the page to export the current filtered results as an Excel file for further in-depth analysis.
3. Report Metrics Definitions
| Column Name | Data Description | Display Example |
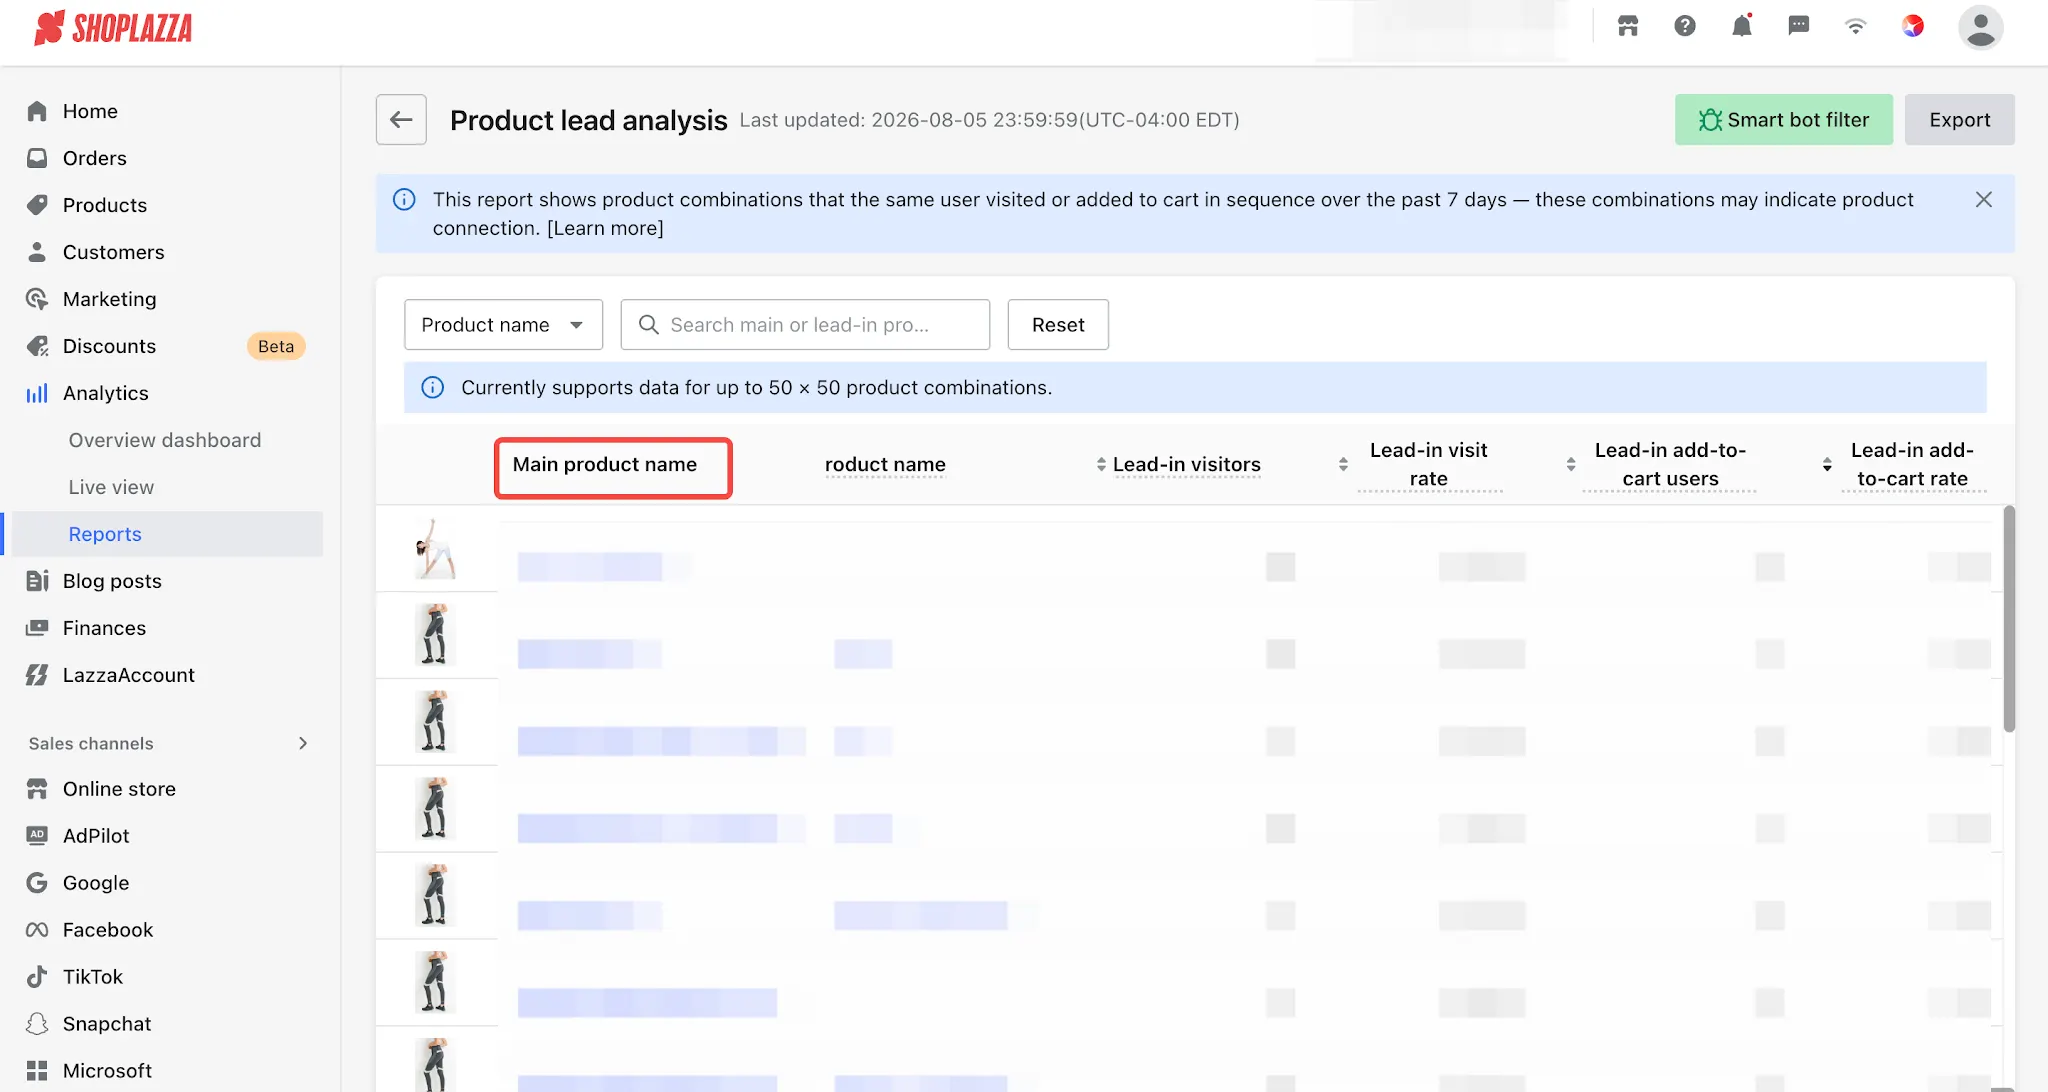
| Main product name | The first product accessed by the user. Displays the product thumbnail and name. Click the product name to navigate to the product details page. |
|
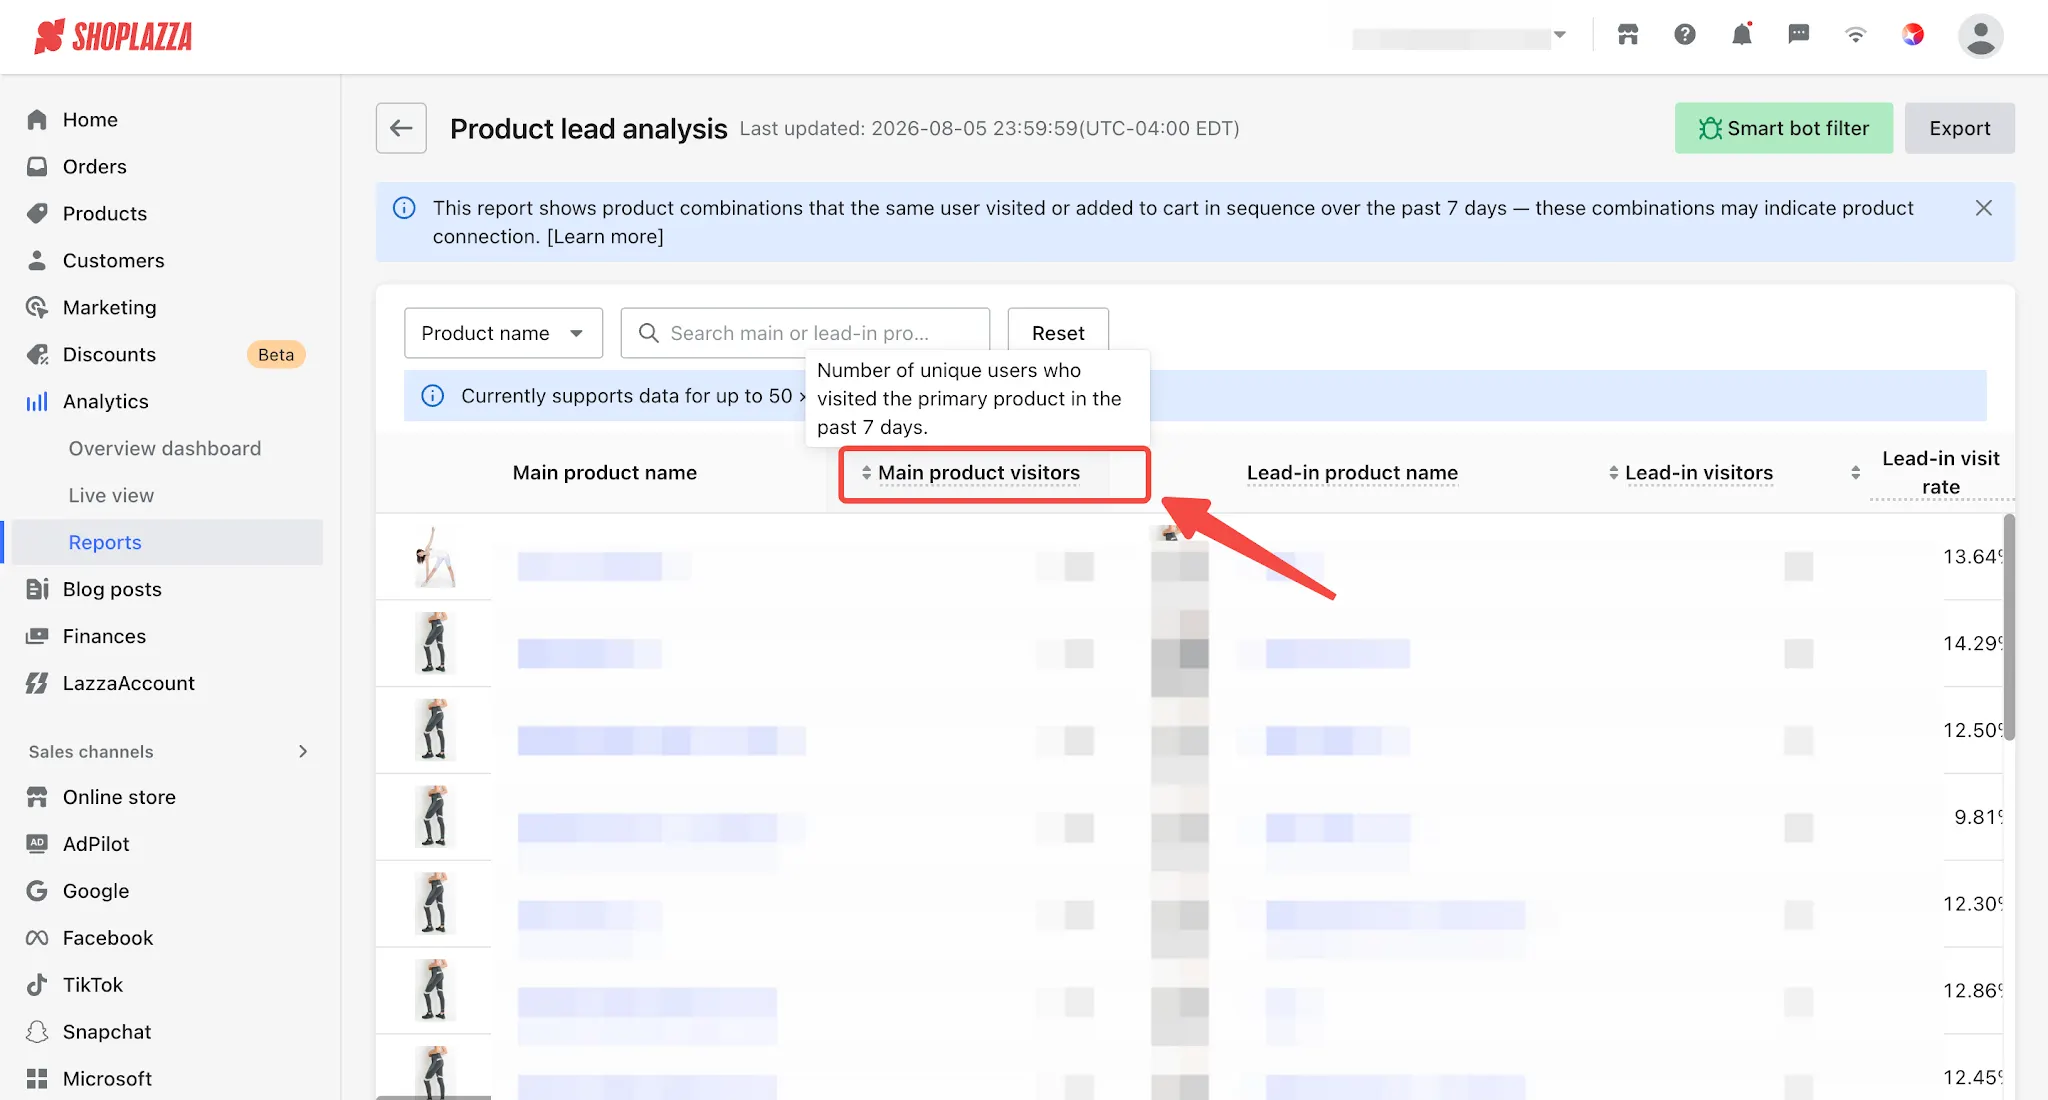
| Main product visitors | Within the statistical period, the number of unique users who visited the main product. This data is also used as the denominator for calculating the lead visit rate and lead add-to-cart rate. |
|
|
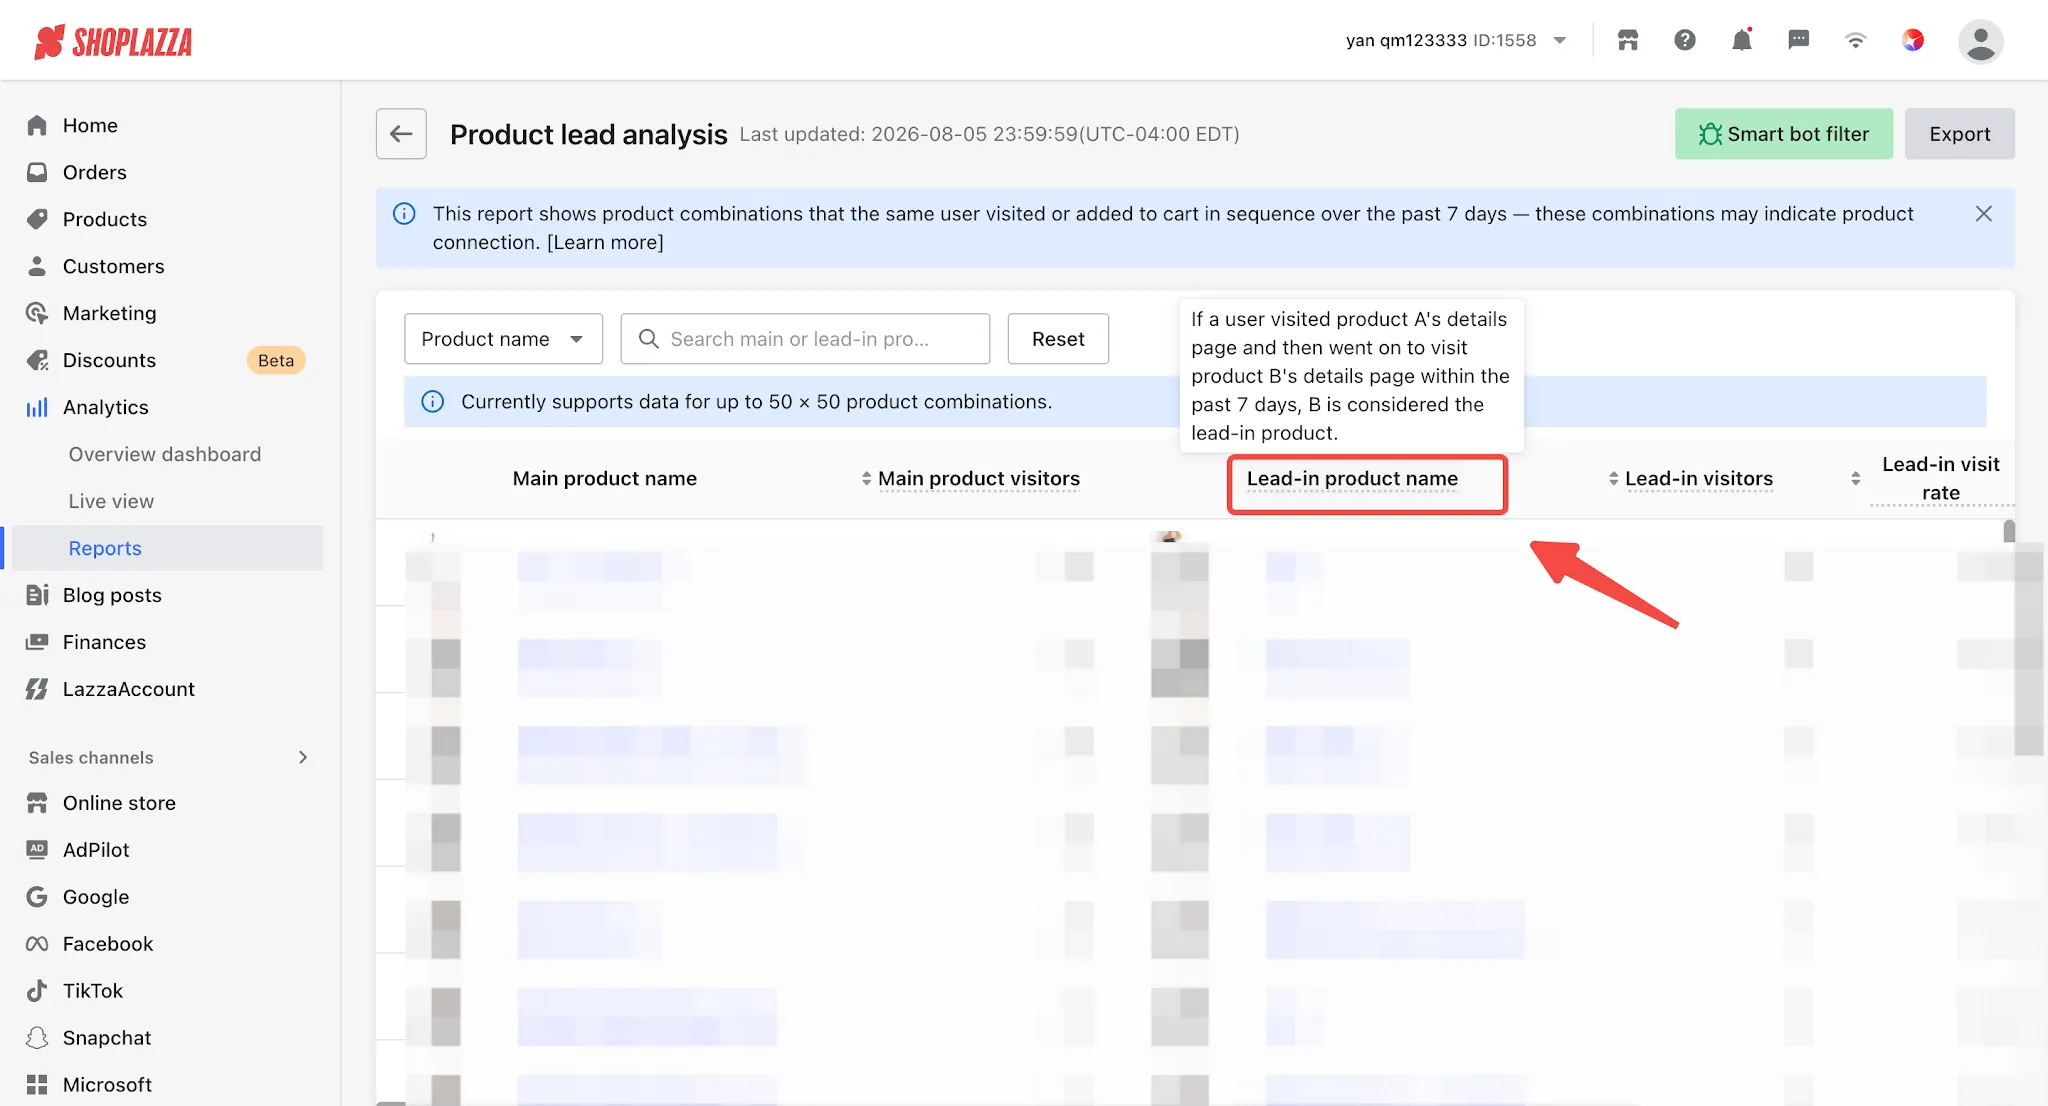
Lead-in product name
|
Products that form a sequential browsing path with the main product — when a user visits the main product detail page and then continues to browse the detail page of another product, that product is considered a lead product. It includes the product thumbnail and product name. |
|
|
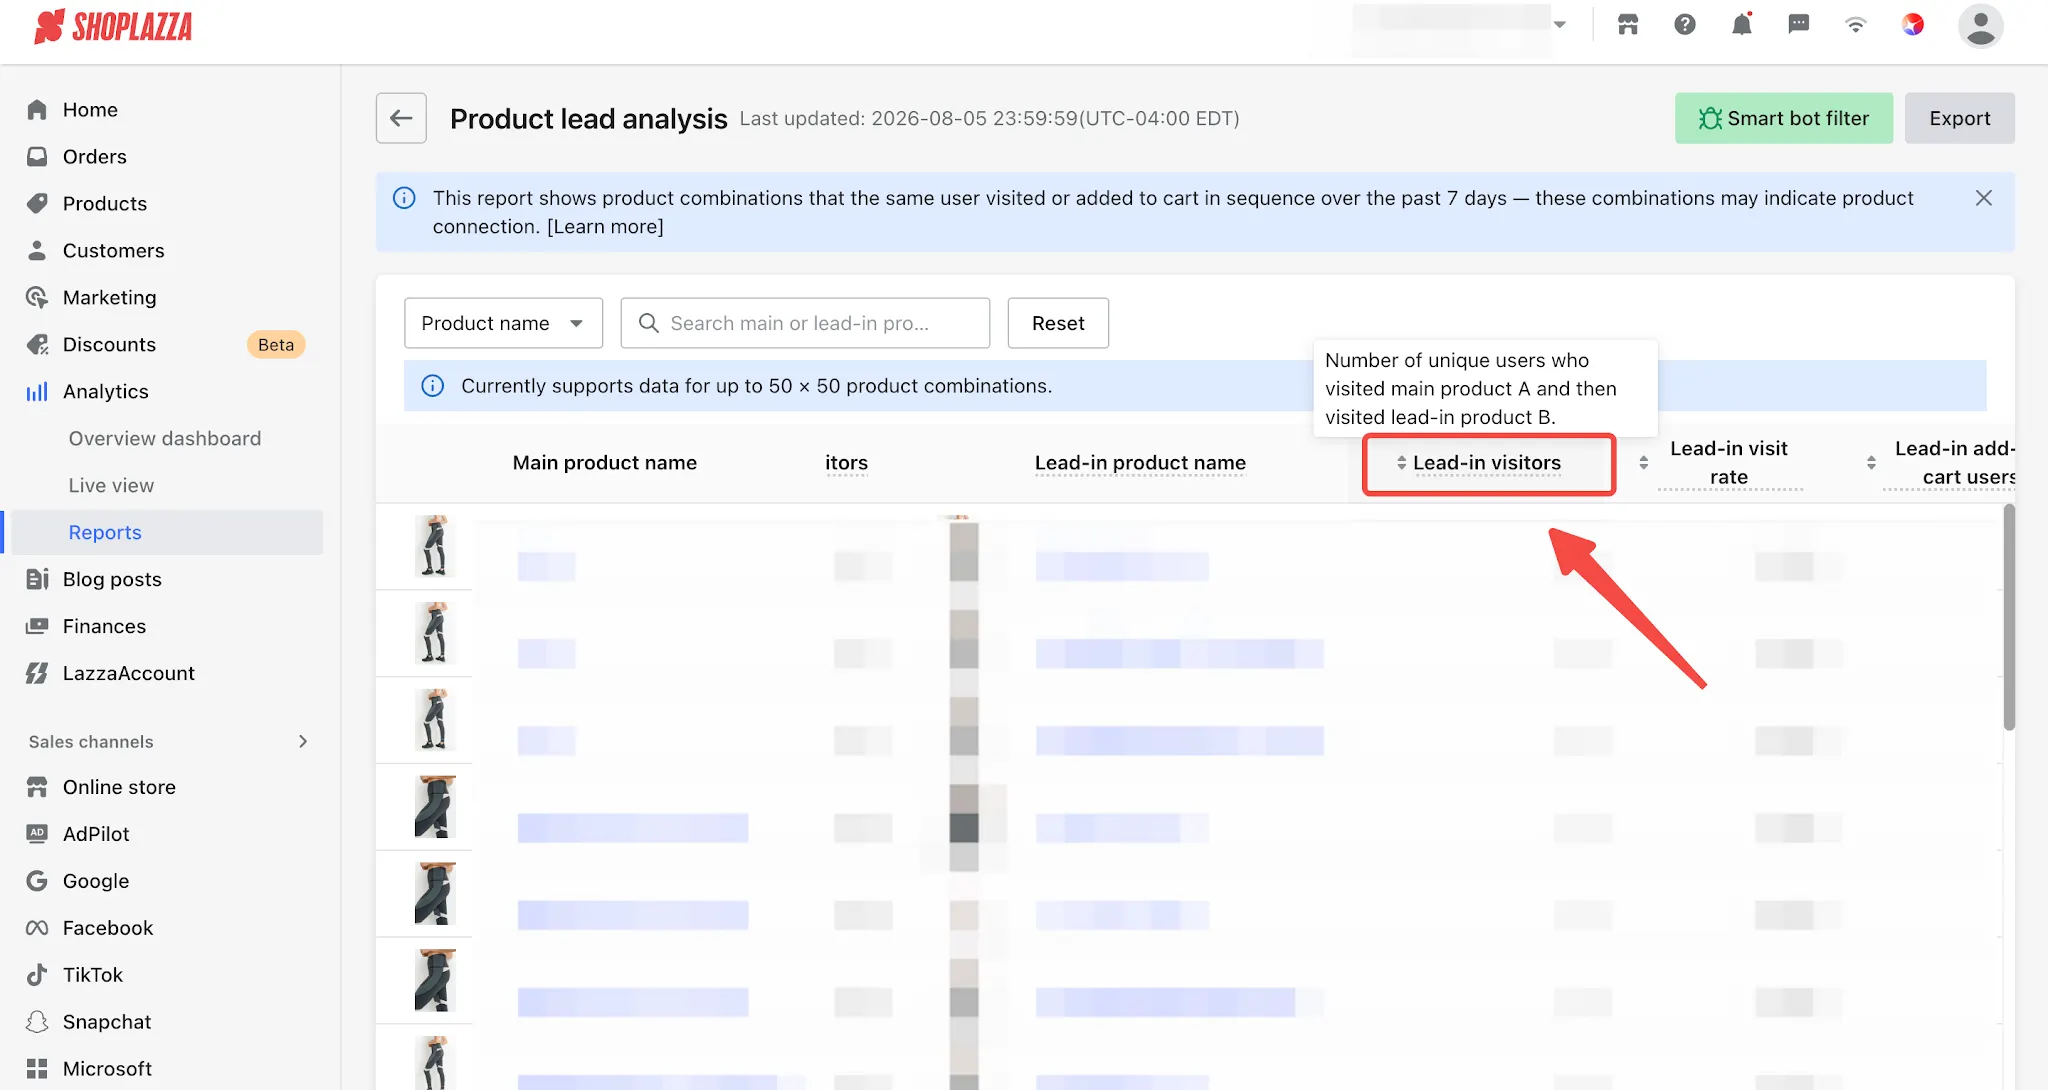
Lead-in visitors
|
The number of unique users who visited the main product first and then visited the lead product. |
|
|
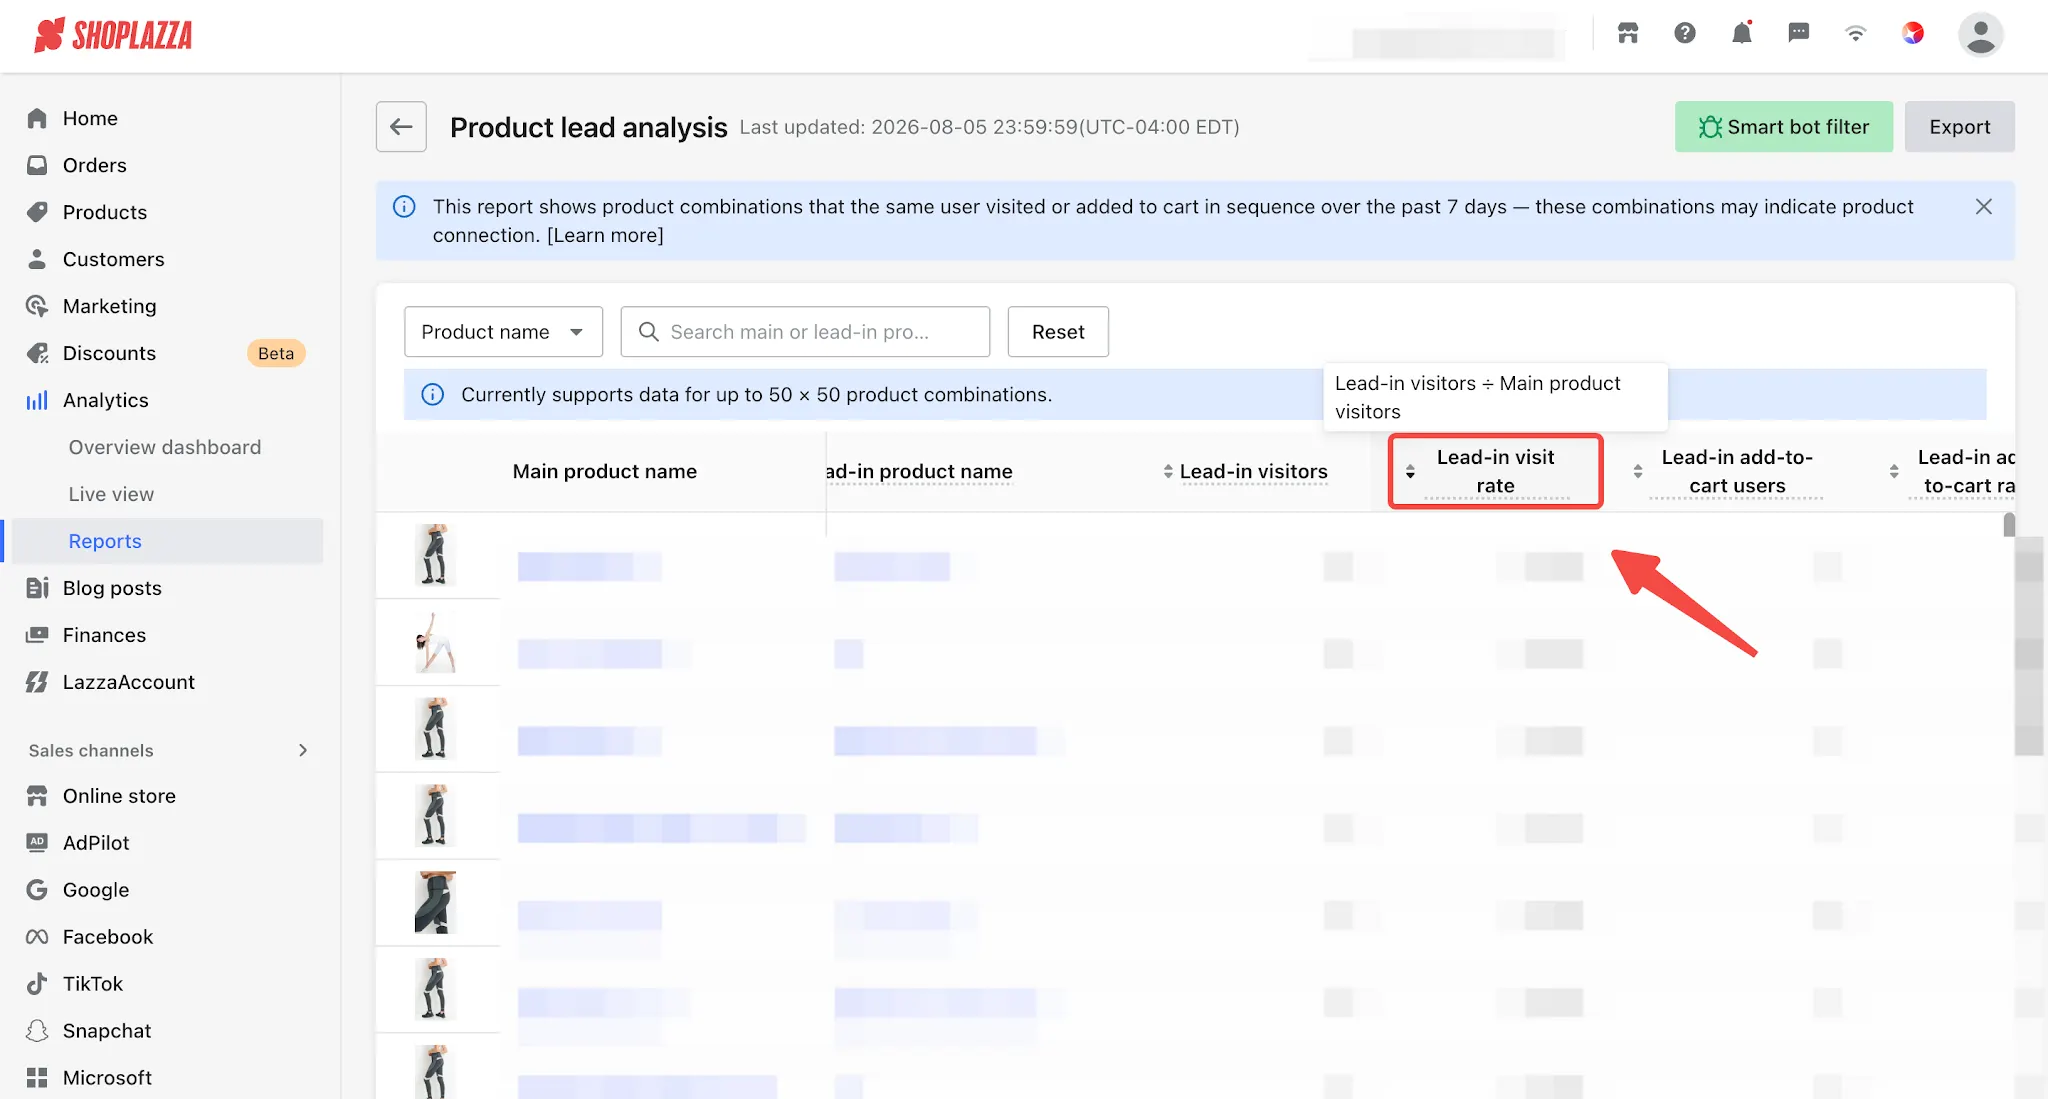
Lead-in visit rate
|
Lead visit users ÷ main product visit users, reflecting the impact of the main product on driving visits to the lead product. |
|
|
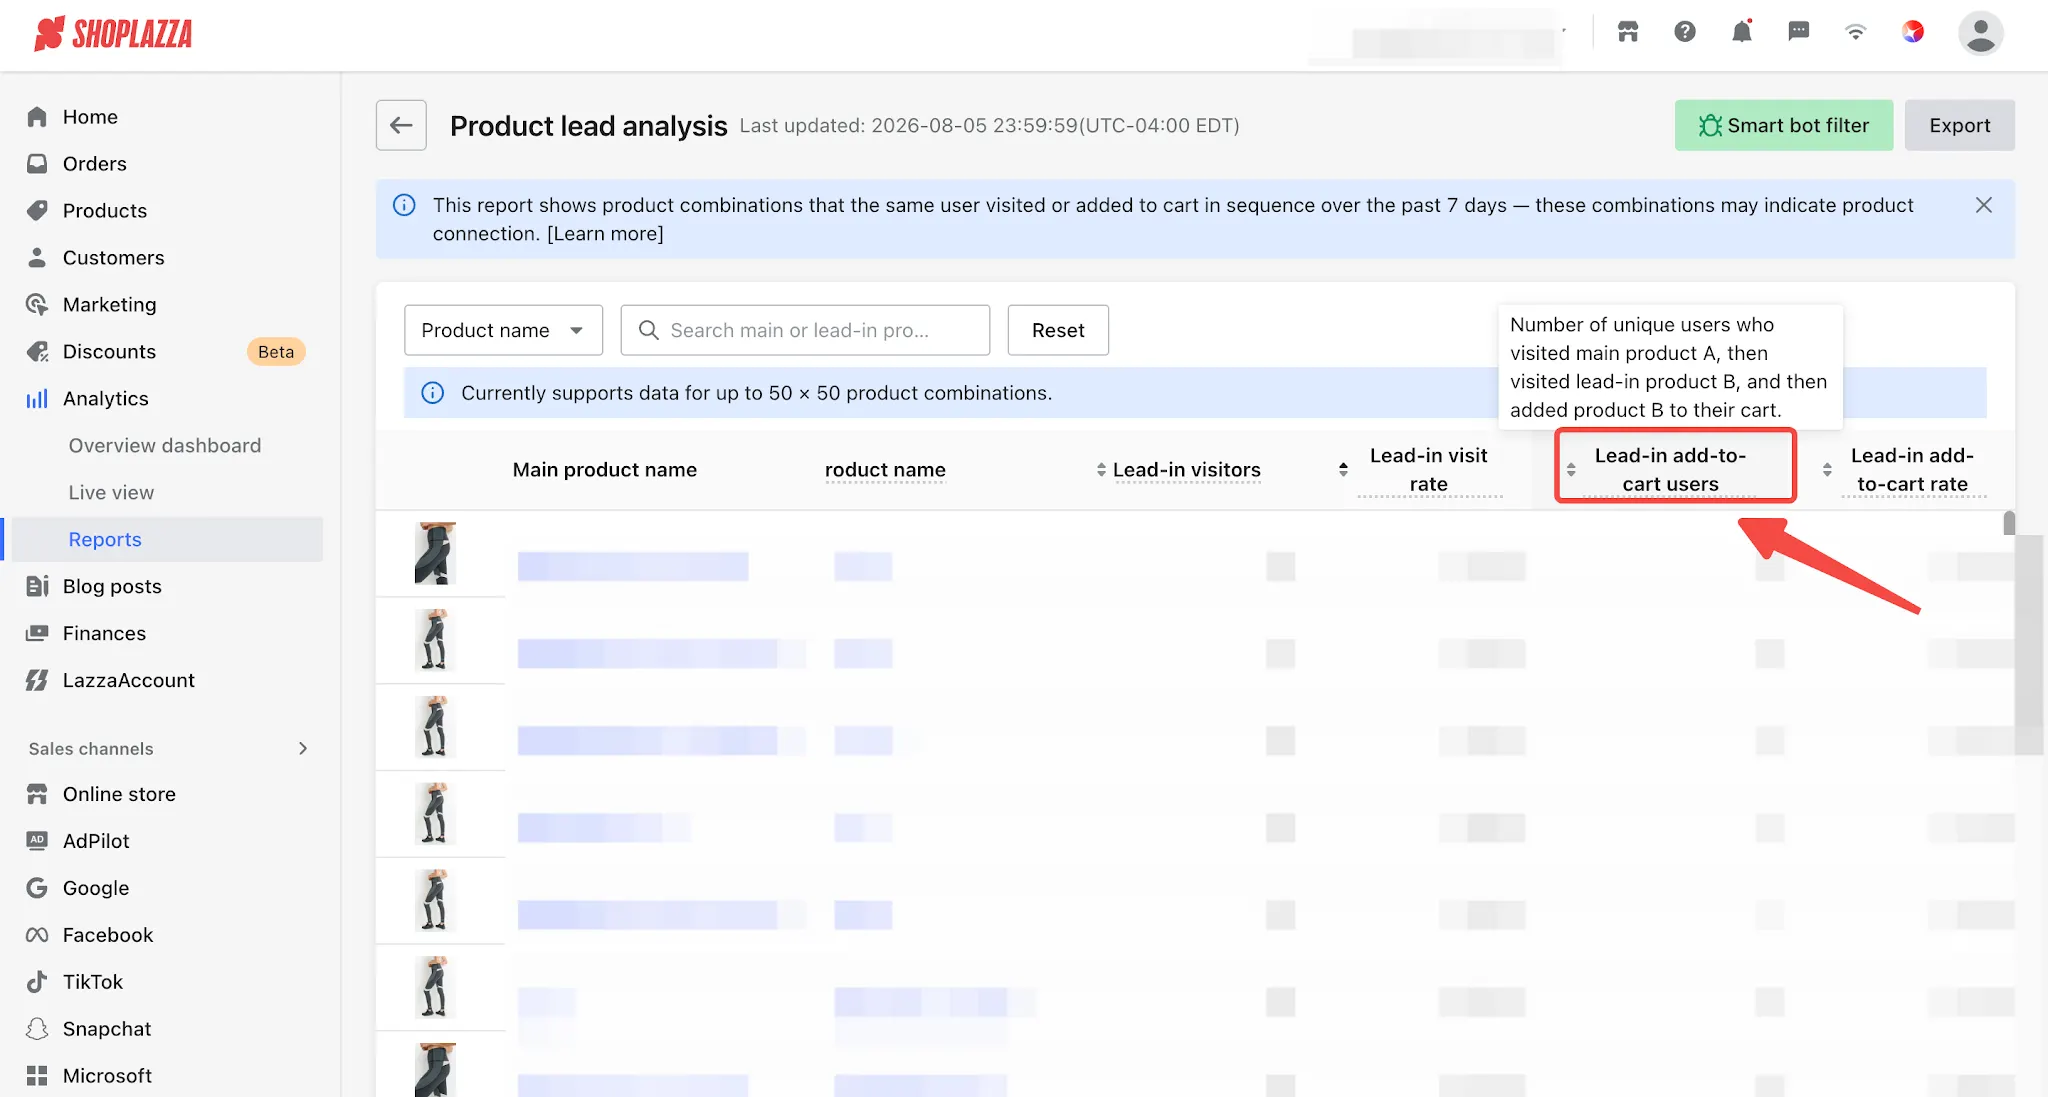
Lead-in add-to-cart users
|
The number of unique users who visited the main product first, then visited the lead product, and finally added the lead product to their cart. |
|
|
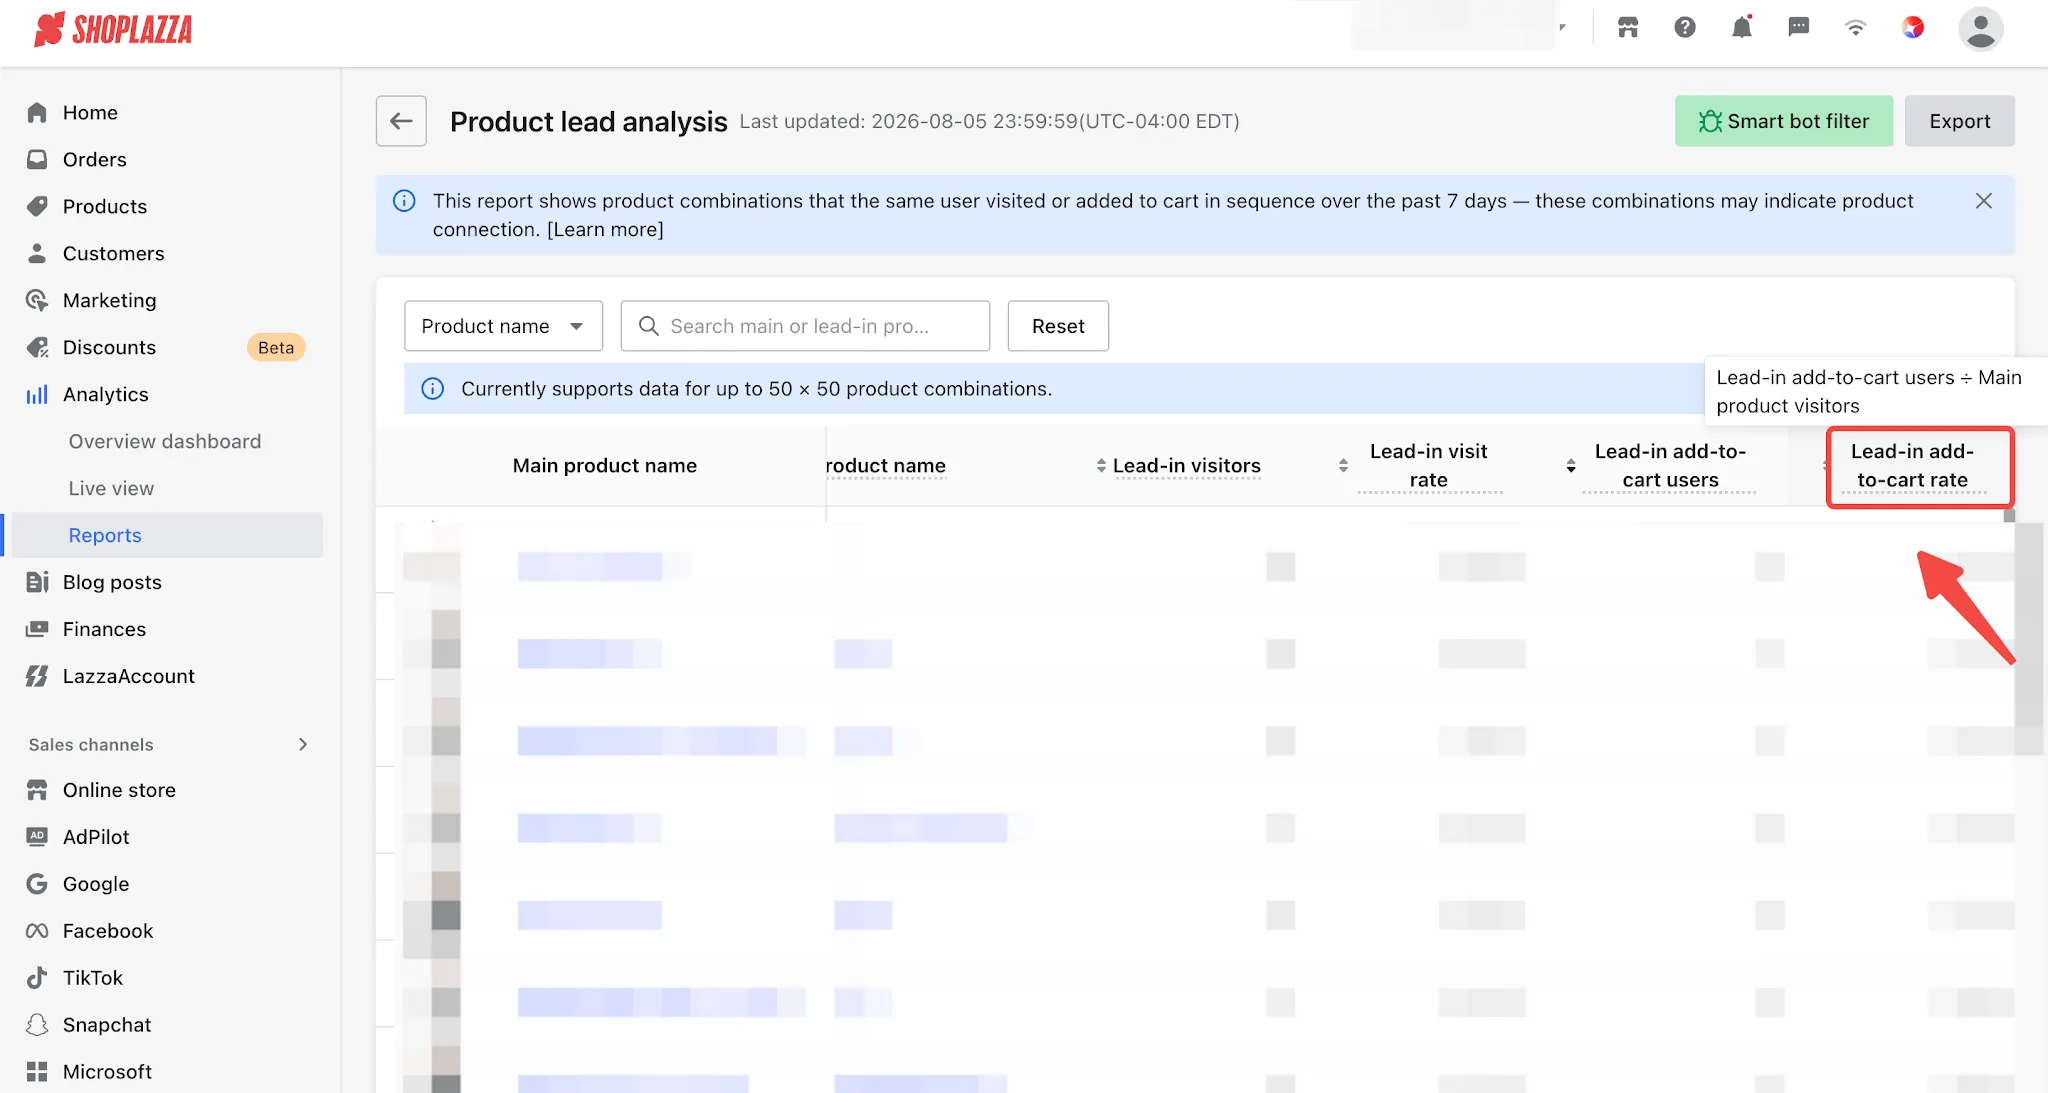
Lead-in add-to-cart rate
|
Lead add-to-cart users ÷ main product visit users, reflecting the impact of the main product on driving add-to-cart behavior for the lead product. |
|
Note
The number of Lead-in add-to-cart users is always ≤ the number of Lead-in visitors. You can compare these two metrics horizontally to clearly identify user drop-off between the Lead-in add-to-cart users and Lead-in visitors stages.
4. Data Rules Explanation
4.1 Reporting Period
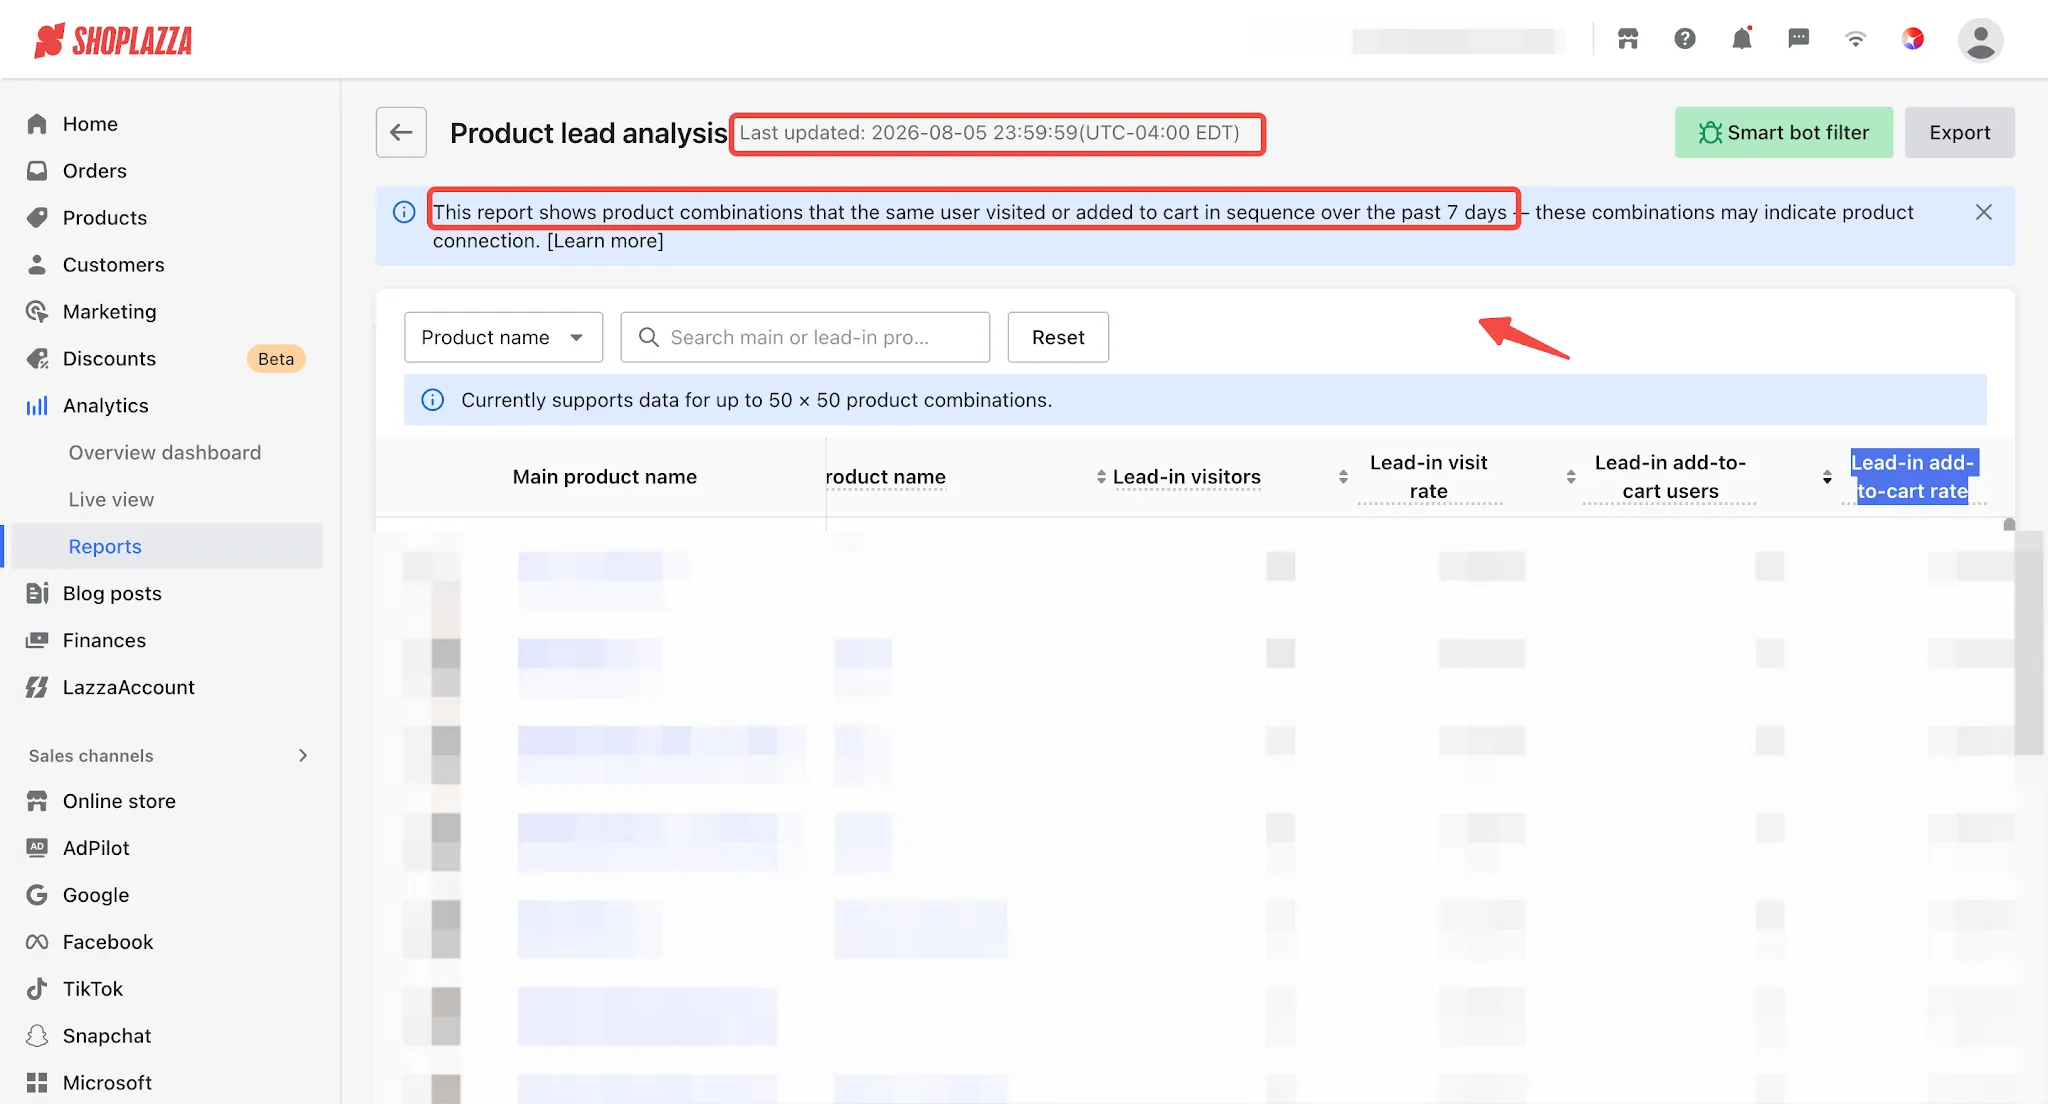
The report displays data from the past 7 days, with a data update cycle of T+1. This means that user behavior data from the current day will not be displayed in real time and will only be updated after data processing is completed the following day. The report data is updated up to the previous day. The current data cutoff time is displayed next to the page title.
4.2 Display Scope
The report displays up to 50 main products with the highest number of visitors. Each main product can display up to 50 products. Therefore, the report can display a maximum of 2,500 records in total.
4.3 Display Criteria
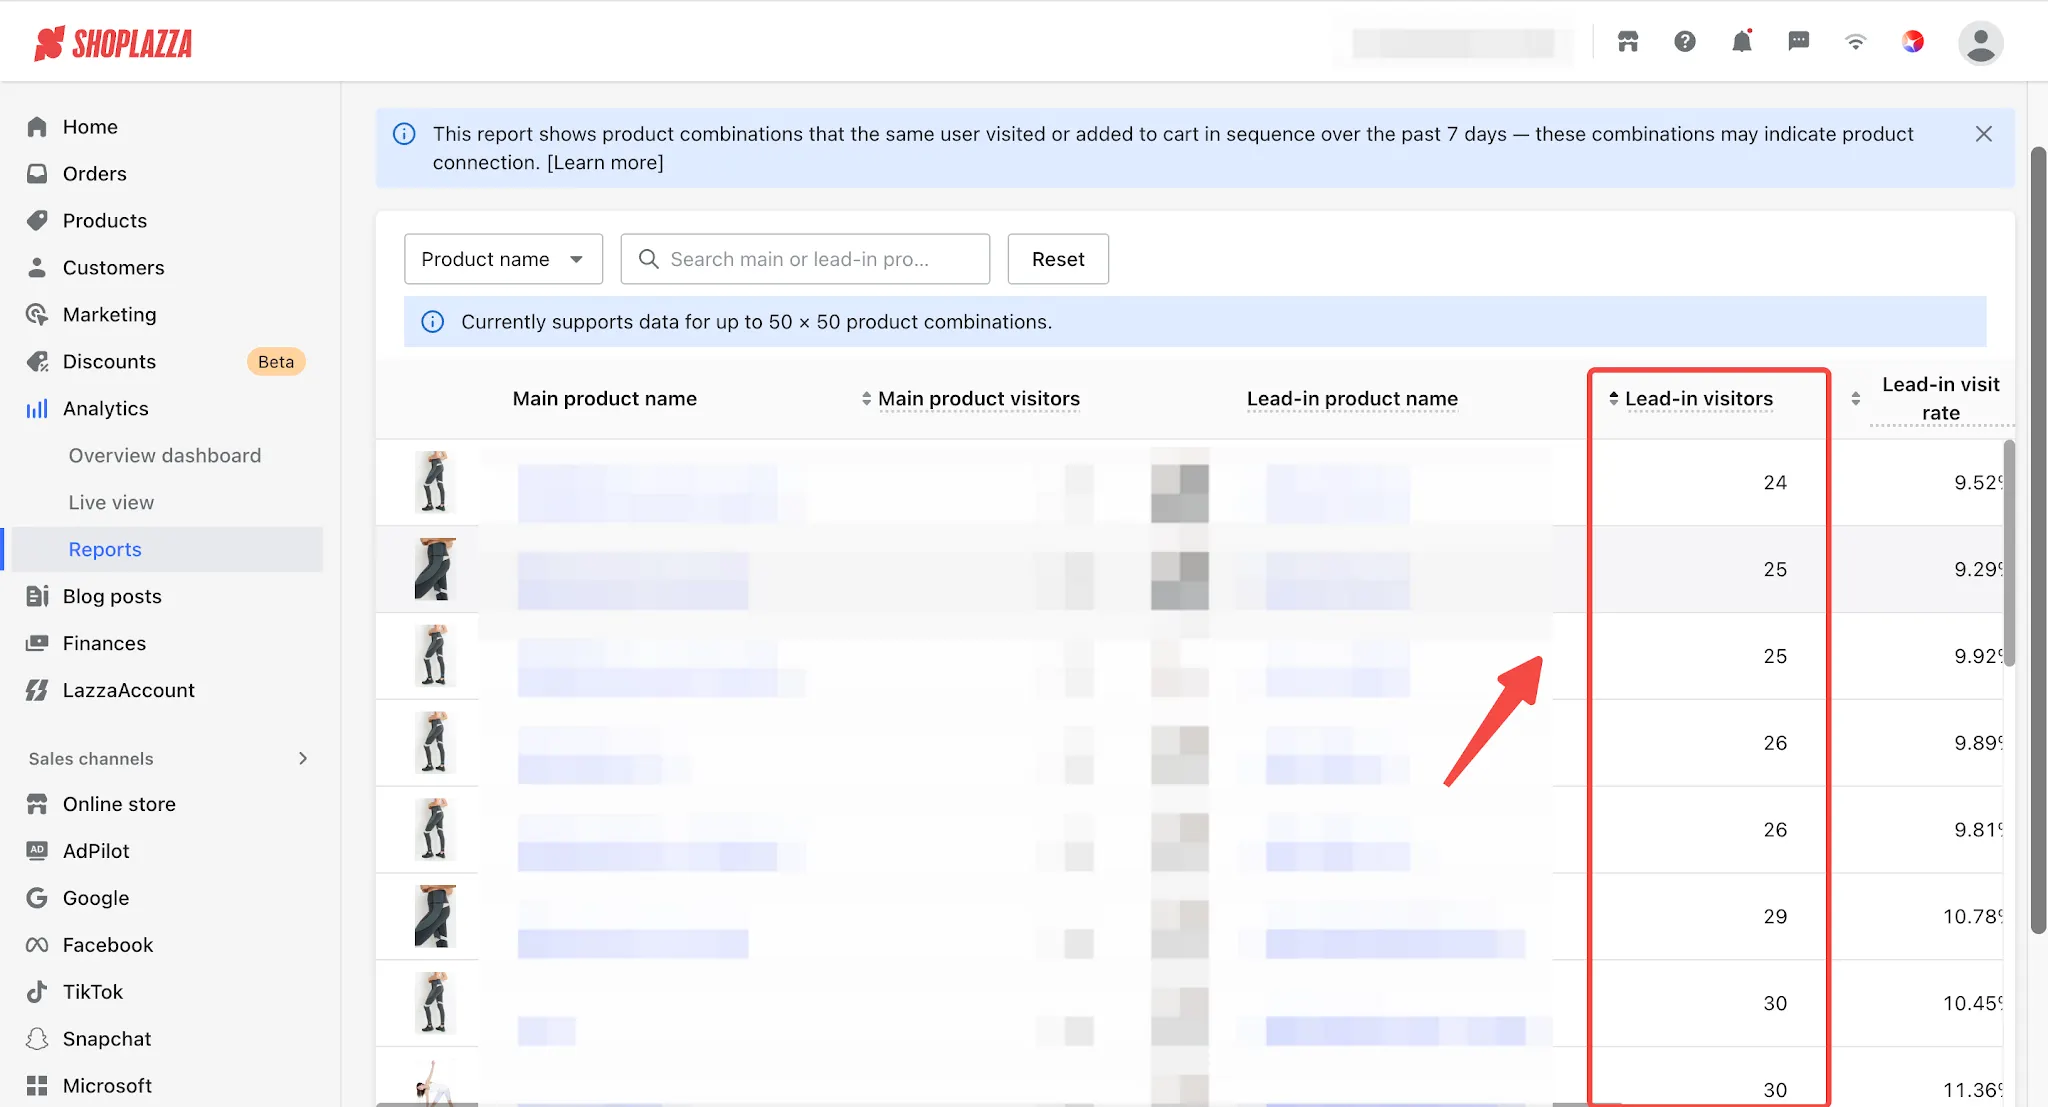
Only product combinations with Lead-in Visitors > 0 will be displayed.
5. Operational Recommendations
- Utilize high lead product combinations to optimize related product recommendation modules on the store homepage and product detail pages, improving cross-selling conversion.
- Refer to the product lead relationships in the report to identify product combinations that customers are interested in. For example, you can create bundle sales campaigns. For more details, refer to Bundle Sales.
- When running ads, create targeted campaigns for products with high lead relationships to maximize traffic value.


Comments
Please sign in to leave a comment.